How to specify the size of a graph in ggplot2 independent of axis labels
Asked Answered
M

7

20

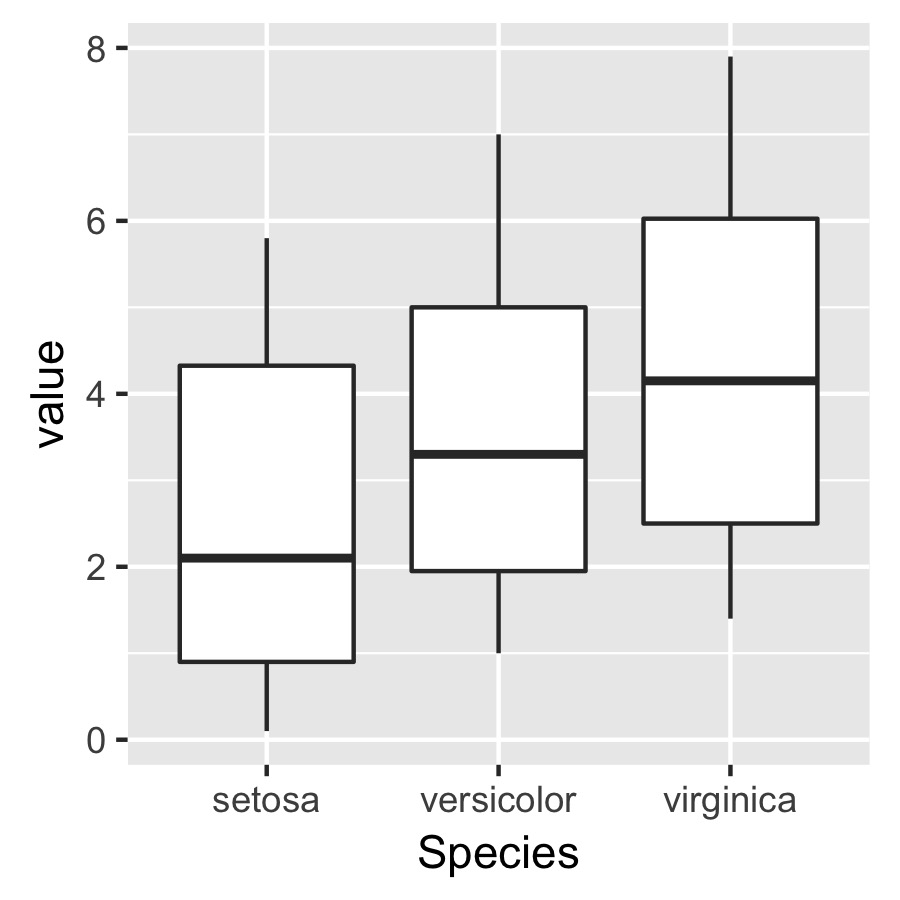
Say I have a data frame and want to make a plot

df <- melt(iris)

p <- ggplot(data = df, aes(x = Species, y = value)) + 
       geom_boxplot() + theme(aspect.ratio = 1)

I then want to use ggsave() to save a pdf of this plot

ggsave(plot = p, width = 3, height = 3, dpi = 300, filename = "not squished axis.pdf")

enter image description here

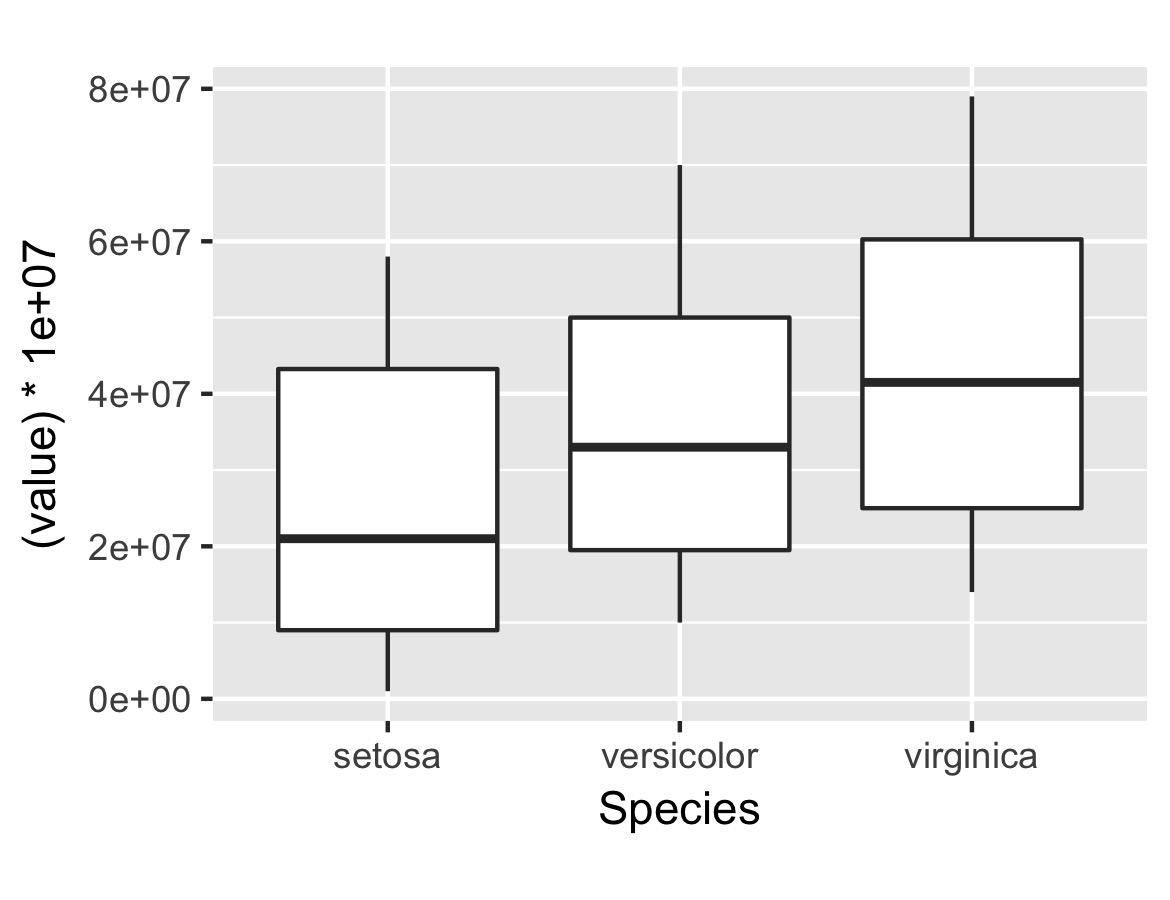
The problem is that I want to specify the dimensions of the plot itself but independently of the axis labels so that the plot specified below will have the same size and dimensions in terms of the absolute length of the axes.

q <- ggplot(data = df, aes(x = Species, y = (value)*10000000)) +
       geom_boxplot() + theme(aspect.ratio = 1)

ggsave(plot = q, width = 3, height = 3, dpi = 300, filename = "squished axis.pdf")

enter image description here

Is there a way to do this easily?

Here is an example of a plot closer to what I would like in terms of the axis lengths:

enter image description here

the only problem is that by changing the aspect ratio, I end up squishing the y axis to make the x axis closer to even in length...

Mirianmirielle answered 20/10, 2017 at 0:24 Comment(4)
I don't understand the question. "Independent of axis labels" meaning what? If you specify height and width in ggsave the plot will have the same dimensions (in pixels/inches) and (depending on the data) different axis ranges. Can you include a mockup/sample figure of what you'd like to achieve?Sextuple
the absolute length of the axes is different in the two plots above because the y axis break labels are longer in the second plot than in the first plot. I would like to be able to have different length axis labels but maintain the same x axis and y axis lengths. I have updated the question with a third plot that looks closer to what I would like to achieveMirianmirielle
@MauritsEvers I'm having trouble making a representative plot of what I want but essentialy I want the size of the graphing area (i.e., the length in inches of the x and y axes) to be consistent between plots that have longer labels for the y axis as a result of the numbering being in a longer formatMirianmirielle
I'm sorry but I have no idea what you mean/want. You say that "the only problem is that by changing the aspect ratio, I end up squishing the y axis to make the x axis closer to even in length". I don't understand what that means. Do you want to have the same scale for two plots having different ranges? If so, you can use facet_wrap to plot both datasets on the same scale. See my example below.Sextuple
B
6

Use ggplotGrob. Something like this:

g1 <- ggplot(...)
g2 <- ggplot(...)

g1grob <- ggplotGrob(g1)
g2grob <- ggplotGrob(g2)

grid.arrange(g1grob, g2grob)
Bride answered 30/5, 2018 at 21:13 Comment(0)
S
5

I don't really understand what you're after, so this is a bit of a stab in the dark.

You can show two plots using the same scale using facet_wrap:

# Your sample data
df <- list(
    one = melt(iris),
    two = with(melt(iris), cbind.data.frame(Species, variable, value * 1000)));
df <- melt(df);

ggplot(df, aes(x = Species, y = value)) + 
    geom_boxplot() + theme(aspect.ratio = 1) + 
    facet_wrap(~ L1);

enter image description here

Or allow the y-scale to vary freely for every facet.

ggplot(df, aes(x = Species, y = value)) + 
    geom_boxplot() + theme(aspect.ratio = 1) + 
    facet_wrap(~ L1, scales = "free_y");

enter image description here

You can tune the grid layout of the facets, by specifying the number of columns or rows using nrow and ncol.

So for example, for vertical placement of both plots you can do

ggplot(df, aes(x = Species, y = value)) + 
    geom_boxplot() + theme(aspect.ratio = 1) + 
    facet_wrap(~ L1, ncol = 1, scales = "free_y");

enter image description here

Sextuple answered 20/10, 2017 at 4:58 Comment(7)
Thanks, yes, facet wrap does result in the the plotting space being even but I would really like to make the plots separately. Using your final example as a reference, notice how the grey plotting area of the two plots are the same length even though the values 8000, 6000, 4000 etc. extend further than the values 8, 6, 4, etc. However as you can see in my examples when I ggsave these pdfs, the length of the x axis gets squished to accommodate length of the y axis values.Mirianmirielle
Not specifying the "height" and "width" dimensions of the the plot to be saved with ggsave() does what I want in terms of preventing the axis labels from squishing the plotting area, however, I want all my plots to be saved with the plotting areas (length of the x axis and length of the y axis) to be a certain lengthMirianmirielle
I'm afraid in that case your best bet is facet_wrap. To be honest your plotting requirements seem very odd to me; it seems to be a purely aesthetic issue. One that can be easily addressed with facet_wrap. Which you don't want to use for some reason. Anyway. Good luck, I've got no further help I can offer.Sextuple
facet wrap does not work with a function I wrote to place a pvalue a specific distance above the comparisons being made. The size requirements are because when I bring the pdf files into illustrator, I want the fonts and plot sizes to all be fixed and a specific size so that I don’t have to resize them and move the text around to fit be resized plotMirianmirielle
My (academic research-centric) advice is that if you can't get it done in ggplot, you're probably not thinking about visualising your data in the right way! The plethora of responses that your question has generated shows that yours probably belongs in that bucket. I've generated a lot of figures for a lot of journal papers and clients, and I've never come across your issue. My meta-advice aside, facet_wrap does work with annotations per facet, there are plenty of examples around on SO. Also, have a look at ggpubr which might provide exactly what you're after.Sextuple
I don't mean to be rude because I appreciate your attempt at helping but I don't think I agree. I may not be explaining myself as well as I could but what I want is to be able to save all of my plots from ggplot with the same height and width in inches or centimeters for the axis independent from all text elements. I have some plots that could be facet wrapped but others that will go into the same paper which cannot be. I am looking for consistency in the size of the plots across all of my figures. I don't like to rescale my plots in illustrator because then the shapes get rescaled as well.Mirianmirielle
I am actually using ggpubr already but I have not been able to figure out how to specify the heights of the comparison bars when facet wrappingMirianmirielle
P
4

This is a bit late to answer your question, but I think this post may help: ggplot2, arrange multiple plots, all the same size, no gaps in between

So basically you want the plotting area (area inside the x and y axis) to be the same for multiple graphs. This is an issue I have found with using ggplot2 as well. One solution is to pass each plot through the align_plots() function in the cowplot package:

`allplotslist <- align_plots(plot1, plot2, plot3, align = "hv")`

This makes the plot area of all the plots the same size. Then you can use ggdraw() (also from cowplot) to place the plots into the same figure, specifying the co-ordinates for each plot, and the size as (x co-ord, y co-ord, width, height):

`final_figure <- ggdraw() + draw_plot(allplotslist[[1]], 0,0,0.3,0.3) + 
draw_plot(allplotslist[[2]], 0,0.3,0.3,0.3) + draw_plot(allplotslist[[3]], 0,0,0.6,0.3)`

you could also use other functions like plot_grid() (from cowplot) or grid.arrange() (from gridExtra package) to plot the new plots that are all the same size:

`grid.arrange(allplotslist[[1]], allplotslist[[2]], allplotslist[[3]])`

Hope that helps, Cheers

Pompous answered 18/3, 2019 at 1:43 Comment(0)
E
3

I observed the same behavior which is magnified when using vertical labels on the x-axis.

Using the following code the area of the plot will vary due to the differences in the label lengths.

library(ggplot2)
library(gridExtra)


df1 <- data.frame(x_label=c(rep("one", 10), rep("two", 20), rep("three", 30))) 

plt1 <- ggplot(data.frame(df1), aes(x=x_label)) +
  ggtitle("My test data percentages") + 
  labs(x="", y="Percentage" ) + 
  geom_bar(aes(y = ( (..count..)/sum(..count..) * 100.0) ), width=1) +
  expand_limits(y=c(0.0, 50.0)) +
  theme_light() +
  theme(plot.title = element_text(hjust = 0.5), axis.text.x=element_text(angle=90, hjust=1, size=8), panel.spacing.x=unit(0.5, "lines")) 

df2 <- data.frame(x_label=c(rep("very long label one", 10), rep("very long label two", 20), rep("very long label three", 30))) 

plt2 <- ggplot(data.frame(df2), aes(x=x_label)) +
  ggtitle("My test data percentages") + 
  labs(x="", y="Percentage" ) + 
  geom_bar(aes(y = ( (..count..)/sum(..count..) * 100.0) ), width=1) +
  expand_limits(y=c(0.0, 50.0)) +
  theme_light() +
  theme(plot.title = element_text(hjust = 0.5), axis.text.x=element_text(angle=90, hjust=1, size=8), panel.spacing.x=unit(0.5, "lines")) 

gridExtra::grid.arrange(plt1, plt2, nrow=1)

Plot area changes as a function of label length

Eury answered 3/10, 2018 at 20:3 Comment(0)
B
3

There are multiple discussions about similar questions online.
For me, the best one is teunbrand using ggh4x package.
While a lot of other solutions require align two or more figures, the one with ggh4x could specify the size of panel directly. In addition, the results are still ggplot objects!
Under a lot of situations, I need to general a lot of single figures, with fixed panel sizes, and later choose some of these figures in publications. In this case, I really need the panel size to be fixed rather than the overall fig size to be fixed.

library(reshape2)
library(ggplot2)
library(ggh4x)

df <- melt(iris)

p <- ggplot(data = df, aes(x = Species, y = value)) + 
  geom_boxplot() + theme(aspect.ratio = 1)+
  force_panelsizes(rows = unit(3, "in"),
                   cols = unit(3, "in"))
  
q <- ggplot(data = df, aes(x = Species, y = (value)*10000000)) +
  geom_boxplot() + theme(aspect.ratio = 1)+
  force_panelsizes(rows = unit(3, "in"),
                   cols = unit(3, "in"))
ggsave(plot = q, width = 5, height = 5, dpi = 300, filename = "squished axis.pdf")
ggsave(plot = p, width = 5, height = 5, dpi = 300, filename = "not squished axis.pdf")
Bicipital answered 25/8, 2022 at 23:54 Comment(1)
Thank you for this comment as an answer, the question is better formulated here but the answer using the ggh4x is the simplest and the robust one (instead of the various other tricks)Mutualism
B
0

I think it is a bit late, but I solved this problem by fixing the nchar of the labels. It's not a very general solution, I know. I needed 30 (or more) separates plots. The number of observations where in a separate underlying grob, so the x-axis has to be fixed in size. Hope this will helps someone

Bookplate answered 15/4, 2020 at 11:8 Comment(1)
I think, I have a similar problem. How did you fix this using nchar?Loredo
P
0

I needed to solve this to get panel areas on different pages of a pdf to match up.

What worked for me was to align all of my plots with the same invisible spacer plot. The spacer plot has text that is longer than any of my other plots so it pushes all of them out to the same dimensions.

dummy_data <- data.frame(x = factor(c("Very Very Long Label")), y = c(0))
spacer_plot <- ggplot(dummy_data, aes(x = x, y = y)) +
    geom_blank() +
    theme(
        axis.text.x = element_text(angle = 90, hjust = 1, vjust = 0.5, color = 'transparent'),
        axis.text.y = element_blank(),
        axis.title = element_blank(),
        axis.ticks = element_blank(),
        panel.grid = element_blank(),
        panel.background = element_blank(),
        plot.margin = unit(c(0,0,0,0), "cm")
    )

aligned_plots <- cowplot::plot_grid(my_plot, spacer_plot, align = 'h', axis = 'tb', nrow = 1, rel_widths = c(1, 0.001))
Pruter answered 2/7, 2024 at 13:1 Comment(0)

© 2022 - 2025 — McMap. All rights reserved.