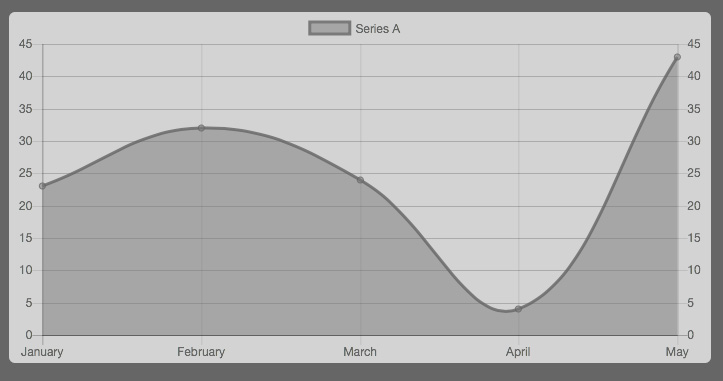
Chart.js same Y axis on left and right
Asked Answered
B

3

20

I have a working chart that I made using chart.js, and by default the Y axis is on the left, but I would like to have Y axis data on both sides

I know I can change sides using:

yAxes: [{
 position: 'right'
}]

but I would like same Y axis data on both sides. Any idea how to do that?

Thank you for your help.

Burgrave answered 2/12, 2016 at 13:24 Comment(0)
V
25

Here's one way:

your yAxes is an Array [] with objects in it {}, so you need to add another yScale to it, here an example:

  scales: {
   yAxes: [{
    display: true,
    position: 'right',
    ticks: {
     beginAtZero: true
    }
   }, {
    display: true,
    position: 'left',
    ticks: {
     beginAtZero: true,
     max: 45,
     min: 0,
     stepSize: 5
    }
   }]
 }

enter image description here

Live demo: Chart.js Double yAxis

Notice you have to reformat one of the new axis to conform to the default, you might need to format both or tie those parameters to your data if it's going to change depending on what you want it to look like.

Vogul answered 3/12, 2016 at 22:53 Comment(1)
this is cool, I found that I can also duplicate same axes on both sides, which makes chart more readable if chart is displayed very large.Reremouse
F
1

The solution of @Keno didn't worked for me. Think because my chart needed to be min: 1000 and not min: 0.

What worked for me was:

scales: {
   yAxes: [{
    display: true,
    position: 'right',
    ticks: {
     beginAtZero: false,
     max: 2000,
     min: 1000,
     stepSize: 100
    }
   }, {
    display: true,
    position: 'left',
    ticks: {
     beginAtZero: false,
     max: 2000,
     min: 1000,
     stepSize: 100
    }
   }]
 }
Feel answered 1/3, 2020 at 15:54 Comment(0)
A
0

This is what works for me, but I still need to display none the scal at the left side

scales: {
    myScale: {
        type: 'linear',
        position: 'right',
    }
}
Anisomerous answered 17/7, 2023 at 14:13 Comment(0)

© 2022 - 2024 — McMap. All rights reserved.