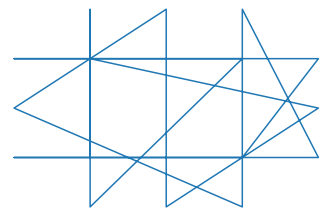
ordering shuffled points that can be joined to form a polygon (in python)
Asked Answered
F

2

20

I have a collection of points that join to form a polygon in 2D cartesian space. It is in the form of a python list of tuples

[(x1, y1), (x2, y2), ... , (xn, yn)]

the problem is the join them and form a polygon in a graph. (I'm using matplotlib.path)

I made a function to do this. It works as follows:

it goes to first point ie (x1, y1) and joins a line to next point ie (x2, y2) and a line from (x2, y2) to (x3, y3) and so on .. till the end which is (xn, yn). It closes the polygon by joining (xn, yn) to (x1, y1).

The problem is the list containing these points does not contain the points in the right order so that results in bad drawings like these(Every closed polygon is colored automatically).

Example:

for this list of vertices = `[(-0.500000050000005, -0.5), (-0.499999950000005, 0.5), (-0.500000100000005, -1.0), (-0.49999990000000505, 1.0), (0.500000050000005, -0.5), (-1.0000000250000025, -0.5), (1.0000000250000025, -0.5), (0.499999950000005, 0.5), (-0.9999999750000024, 0.5), (0.9999999750000024, 0.5), (0.500000100000005, -1.0), (0.49999990000000505, 1.0), (-1.0, 0.0), (-0.0, -1.0), (0.0, 1.0), (1.0, 0.0), (-0.500000050000005, -0.5)]

The points: enter image description here

Bad order of points results in: enter image description here

Correct way to join: enter image description here

Is there any good (and easy if possible) algorithm to reorder the points to correct order? `

Fane answered 1/6, 2012 at 7:49 Comment(9)
This doesn't sound like the most general solution, but have you tried connecting each point to the closest neighbor?Barret
Also have a look at this and maybe this.Barret
What is the "right order" then?Ronel
yea I"ve tried connecting points to closest neighbour. It didn't work. Because there have been closest points but when we join them they lead to an intersections or points which are not so close but should be joined togetherFane
@BartKiers made an inkscape diagram for right order to joinFane
There is no "right order" generally, even the example you gave has more solutions (without self-intersections). You must make use of patterns in the data. Your example could be solved e.g. by computing centroid of the cloud and sort your points by angle in polar coordinates with origin at centroid.Mccandless
@Fane This polygon is not convex; how do you tell that the one you show is "right", not something like this (excuse my drawing)? The idea eudoxos means sounds promising to me (the first link in my previous comment also has a more detailed explanation of the idea, except that the poster suggests starting from a random point, not the center). That makes a difference, though.Barret
@Lev Actually the polygons I"m getting are the brilloin zones . For example this example is 1st, 2nd and 3rd brilloin zones of a 2D rectangular lattice combined. see this: doitpoms.ac.uk/tlplib/brillouin_zones/zone_construction.php . so all the polygons should have symmetry w.r.t reflection about x, y axes and x = y axis etc. So, it can't be your polygon(it doesn't have symmetry about x axis)Fane
@Fane I was just pointing out that you need some additional criteria. I'm not sure eudoxos's solution guarantees that in all cases, but seem pretty suitable for your needs.Barret
M
31

This sorts your points according to polar coordinates:

import math
import matplotlib.patches as patches
import pylab
pp=[(-0.500000050000005, -0.5), (-0.499999950000005, 0.5), (-0.500000100000005, -1.0), (-0.49999990000000505, 1.0), (0.500000050000005, -0.5), (-1.0000000250000025, -0.5), (1.0000000250000025, -0.5), (0.499999950000005, 0.5), (-0.9999999750000024, 0.5), (0.9999999750000024, 0.5), (0.500000100000005, -1.0), (0.49999990000000505, 1.0), (-1.0, 0.0), (-0.0, -1.0), (0.0, 1.0), (1.0, 0.0), (-0.500000050000005, -0.5)]
# compute centroid
cent=(sum([p[0] for p in pp])/len(pp),sum([p[1] for p in pp])/len(pp))
# sort by polar angle
pp.sort(key=lambda p: math.atan2(p[1]-cent[1],p[0]-cent[0]))
# plot points
pylab.scatter([p[0] for p in pp],[p[1] for p in pp])
# plot polyline
pylab.gca().add_patch(patches.Polygon(pp,closed=False,fill=False))
pylab.grid()
pylab.show()

resulting polygon

Mccandless answered 1/6, 2012 at 9:39 Comment(0)
C
2

I've done it using a nearest neighbor approach. So the idea is to take a point from the starting list of points as the starting one (in this script I select the very first one), add it to a new list that will be used to store the ordered points, and then check for its nearest neighbor using the formula: np.sqrt((x1-x2)**2 + (y1-y2)**2). Then select that nearest point, add it to the second list, check for its nearest neighbor and verify if this last one is already in the list. If so, then go check for the second one, verify if it's in the second list and so on. The algorithm ends when all points were added to the second list. Here's the code:

import numpy as np
import matplotlib.pyplot as plt


start_lst = [(-0.500000050000005, -0.5), (-0.499999950000005, 0.5), (-0.500000100000005, -1.0), (-0.49999990000000505, 1.0), (0.500000050000005, -0.5), (-1.0000000250000025, -0.5), (1.0000000250000025, -0.5), (0.499999950000005, 0.5), (-0.9999999750000024, 0.5), (0.9999999750000024, 0.5), (0.500000100000005, -1.0), (0.49999990000000505, 1.0), (-1.0, 0.0), (-0.0, -1.0), (0.0, 1.0), (1.0, 0.0), (-0.500000050000005, -0.5)]
listx = [point[0] for point in start_lst]
listy = [point[1] for point in start_lst]

plt.plot(listx,listy)
plt.show()

line-connecting-points

start_point = listx[0], listy[0]
sorted_points = []
while len(start_point)>0:
    sorted_points.append(start_point)
    x1, y1 = start_point
    dists = {(x2, y2): np.sqrt((x1-x2)**2 + (y1-y2)**2) for x2, y2 in zip(listx, listy)}
    dists = sorted(dists.items(), key=lambda item: item[1])
    for dist in dists:
        if dist[0] not in sorted_points: 
            start_point = dist[0]
            break
        if dist == dists[-1]:
            start_point = ()
            break

xs = [point[0] for point in sorted_points]
ys = [point[1] for point in sorted_points]
plt.plot(xs,ys)
plt.show()

cross-polygon

Coyne answered 18/3, 2022 at 23:32 Comment(1)
I used the answer above yours and it came out close for what I needed. Some of the points were still going haywire for the polygon. I used your solution after applying the above answer and it worked. So, thank you for this. Combining each answer was my solution.Cusec

© 2022 - 2024 — McMap. All rights reserved.