Algorithm: Calculate pseudo-random point inside an ellipse
Asked Answered
D

4

20

For a simple particle system I'm making, I need to, given an ellipse with width and height, calculate a random point X, Y which lies in that ellipse.

Now I'm not the best at maths, so I wanted to ask here if anybody could point me in the right direction.

Maybe the right way is to choose a random float in the range of the width, take it for X and from it calculate the Y value?

Disinclination answered 3/4, 2011 at 10:55 Comment(2)
Most of the answers given find points that lie within the ellipse. But your final sentence makes me wonder whether you're wanting only points which lie on the ellipse (since otherwise, it would be unclear how you could "calculate the Y value" given an X value (and ignoring that there would be two Y values)). Could you clarify.Aubreyaubrie
@Aubreyaubrie I think he means calculate the next random parameter given the available range.Goddord
B
35
  1. Generate a random point inside a circle of radius 1. This can be done by taking a random angle phi in the interval [0, 2*pi) and a random value rho in the interval [0, 1) and compute

    x = sqrt(rho) * cos(phi)
    y = sqrt(rho) * sin(phi)
    

    The square root in the formula ensures a uniform distribution inside the circle.

  2. Scale x and y to the dimensions of the ellipse

    x = x * width/2.0
    y = y * height/2.0
    
Buoyant answered 3/4, 2011 at 11:4 Comment(4)
Most of your points will hang out in the middle: hardly random pattern. Also (assuming you solve problem #1), stretching the circle doesn't preserve 'randomness' either.Cooperation
@Nikita As the circle area goes with r^2, taking Sqrt gives you a uniform distribution.Tammietammuz
@Nikita: I had the same reaction. However, the distribution is really uniform (dxdy = rho drho dphi, so when you integrate the right hand side and invert it, you get sqrt(rho), as asserted).Tamas
also, stretching the circle preserves the uniformity, because if you consider two squares one in the center and the second in the periphery, they will both be stretched into rectangles in the exact same way, so their area will remain equalMariken
S
13

Use rejection sampling: choose a random point in the rectangle around the ellipse. Test whether the point is inside the ellipse by checking the sign of (x-x0)^2/a^2+(y-y0)^2/b^2-1. Repeat if the point is not inside. (This assumes that the ellipse is aligned with the coordinate axes. A similar solution works in the general case but is more complicated, of course.)

Static answered 3/4, 2011 at 11:17 Comment(1)
+1. Or sample the unit disc with this very method, and transform it to your ellipse afterwards.Tamas
G
8

It is possible to generate points within an ellipse without using rejection sampling too by carefully considering its definition in polar form. From wikipedia the polar form of an ellipse is given by

Polar radius of ellipse

Intuitively speaking, we should sample polar angle θ more often where the radius is larger. Put more mathematically, our PDF for the random variable θ should be p(θ) dθ = dA / A, where dA is the area of a single segment at angle θ with width dθ. Using the equation for polar angle area dA = 1/2 r2 dθ and the area of an ellipse being π a b, then the PDF becomes

Theta PDF

To randomly sample from this PDF, one direct method is the inverse CDF technique. This requires calculating the cumulative density function (CDF) and then inverting this function. Using Wolfram Alpha to get the indefinite integral, then inverting it gives inverse CDF of

Inverse CDF

where u runs between 0 and 1. So to sample a random angle θ, you just generate a uniform random number u between 0 and 1, and substitute it into this equation for the inverse CDF.

To get the random radius, the same technique that works for a circle can be used (see for example Generate a random point within a circle (uniformly)).

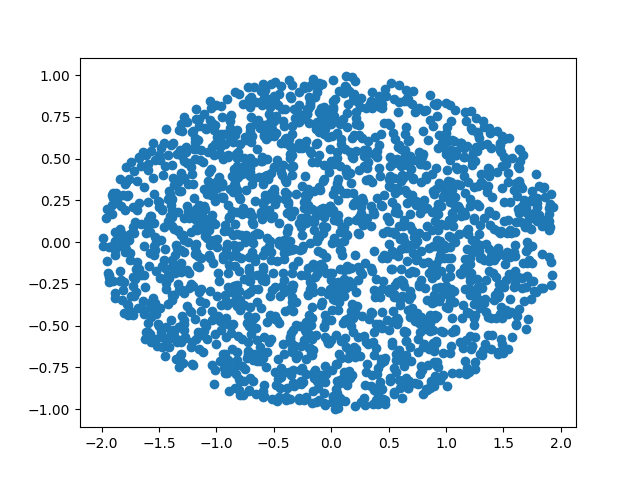
Here is some sample Python code which implements this algorithm:

import numpy
import matplotlib.pyplot as plt
import random

# Returns theta in [-pi/2, 3pi/2]
def generate_theta(a, b):
    u = random.random() / 4.0
    theta = numpy.arctan(b/a * numpy.tan(2*numpy.pi*u))

    v = random.random()
    if v < 0.25:
        return theta
    elif v < 0.5:
        return numpy.pi - theta
    elif v < 0.75:
        return numpy.pi + theta
    else:
        return -theta

def radius(a, b, theta):
    return a * b / numpy.sqrt((b*numpy.cos(theta))**2 + (a*numpy.sin(theta))**2)

def random_point(a, b):
    random_theta = generate_theta(a, b)
    max_radius = radius(a, b, random_theta)
    random_radius = max_radius * numpy.sqrt(random.random())

    return numpy.array([
        random_radius * numpy.cos(random_theta),
        random_radius * numpy.sin(random_theta)
    ])

a = 2
b = 1

points = numpy.array([random_point(a, b) for _ in range(2000)])

plt.scatter(points[:,0], points[:,1])
plt.show()

Randomly generated points within ellipse with axes 2 and 1

Goodman answered 19/10, 2017 at 23:49 Comment(0)
E
0

I know this is an old question, but I think none of the existing answers are good enough.

I was looking for a solution for exactly the same problem and got directed here by Google, found all the existing answers are not what I wanted, so I implemented my own solution entirely by myself, using information found here: https://en.wikipedia.org/wiki/Ellipse

So any point on the ellipse must satisfy that equation, how to make a point inside the ellipse?

Just scale a and b with two random numbers between 0 and 1.

I will post my code here, I just want to help.

import math
import matplotlib.pyplot as plt
import random
from matplotlib.patches import Ellipse

a = 4
b = a*math.tan(math.radians((random.random()+0.5)/2*45))

def random_point(a, b):
    d = math.radians(random.random()*360)
    return (a * math.cos(d) * random.random(), b * math.sin(d) * random.random())

points = [random_point(a, b) for i in range(360)]

x, y = zip(*points)

fig = plt.figure(frameon=False)
ax = fig.add_subplot(111)
ax.set_axis_off()
ax.add_patch(Ellipse((0, 0), 2*a, 2*b, edgecolor='k', fc='None', lw=2))
ax.scatter(x, y)
fig.subplots_adjust(left=0, bottom=0, right=1, top=1, wspace=0, hspace=0)
plt.axis('scaled')
plt.box(False)
ax = plt.gca()
ax.set_xlim([-a, a])
ax.set_ylim([-b, b])
plt.set_cmap('rainbow')
plt.show()

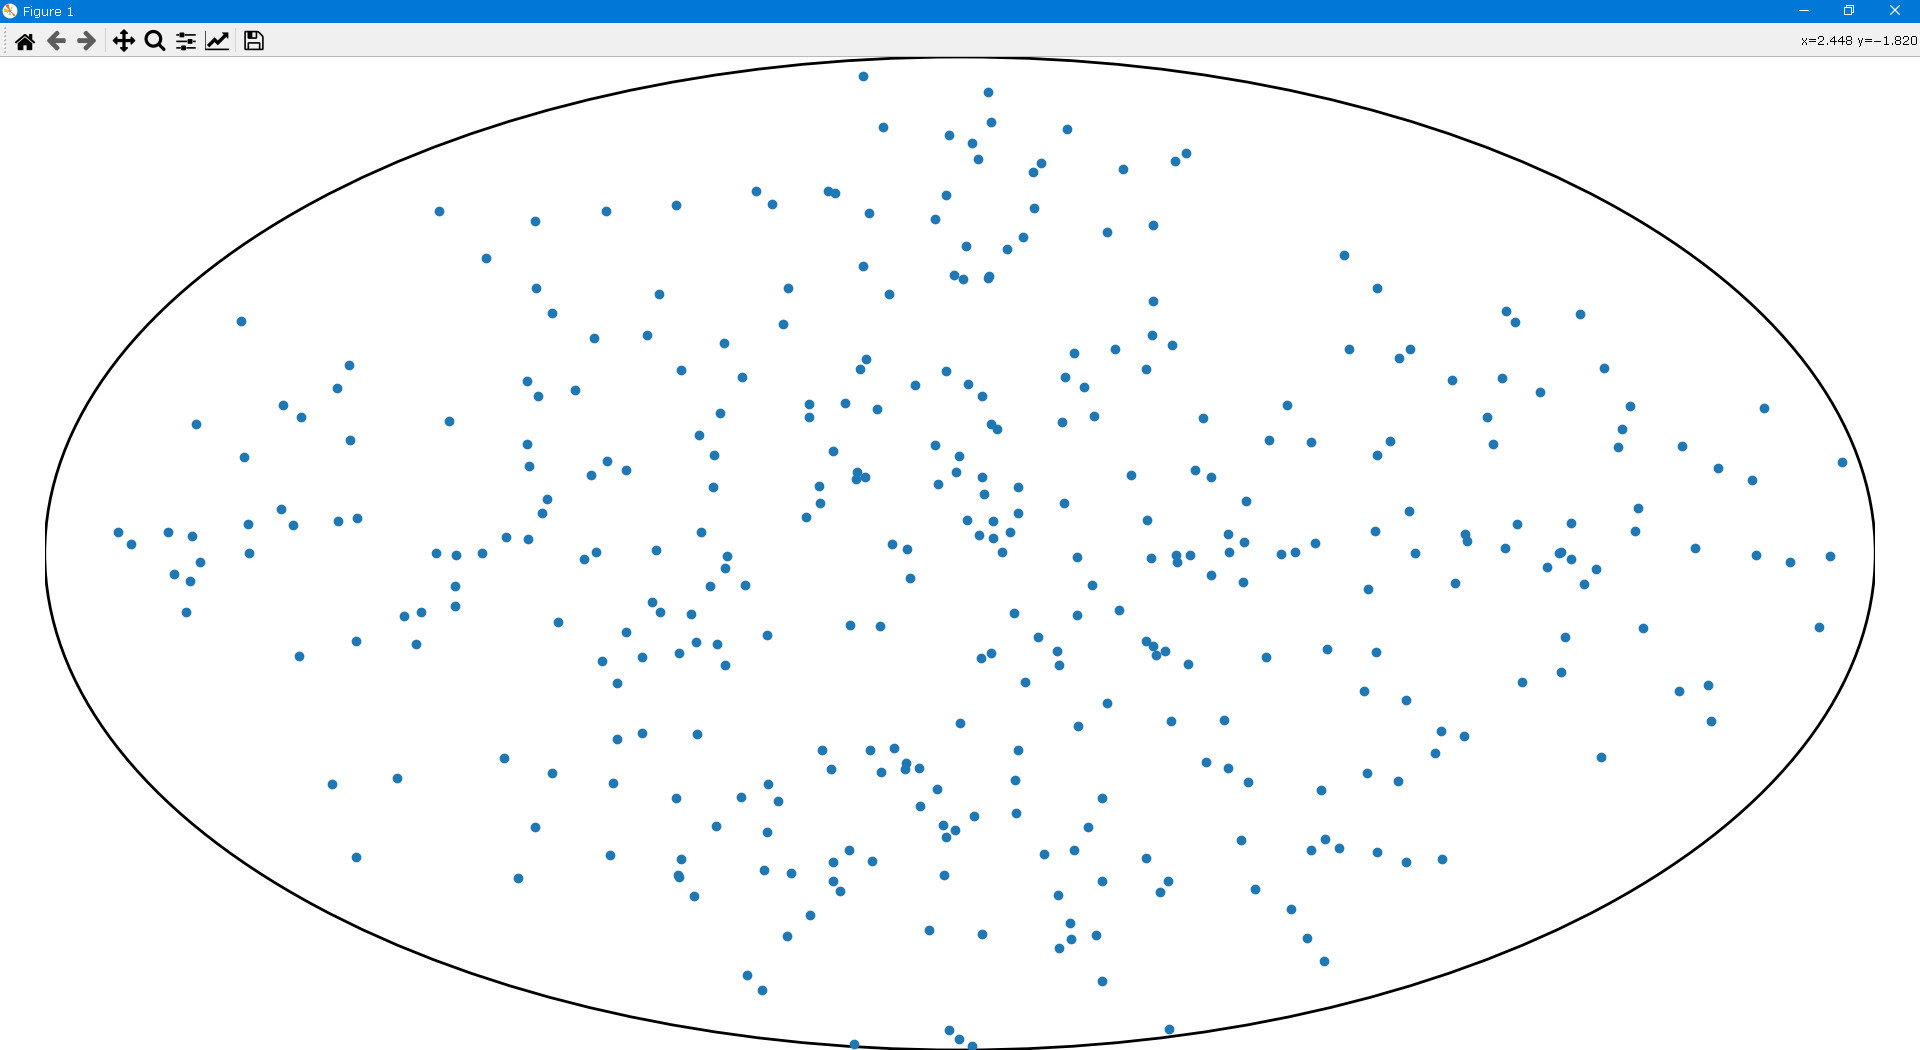
enter image description here

Erdrich answered 21/5, 2022 at 8:49 Comment(1)
This isn't uniform; if you use enough points, you can see they tend to form a cross shape. The four "diagonals" remain largely unpopulated.Dear

© 2022 - 2024 — McMap. All rights reserved.