Very poor performance of async task run on threadpool in .Net native
Asked Answered
D

1

21

I've observed a strange difference in managed vs .Net native code. I've a heavy job redirected to threadpool. When running the app in managed code, everything works smooth but as soon as I switch on native compilation - the task run few times slower and so slow that it hangs UI thread (I guess CPU is so overloaded).

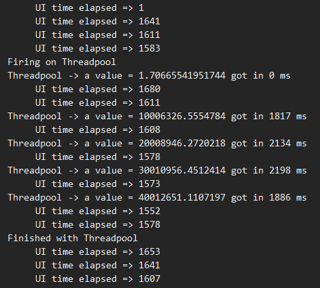
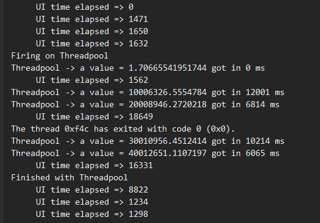
Here are two screenshots from debug output, the one on the left is from managed code, and the one on the right is from native compilation. As you can see the time consumed by UI task is nearly the same in both cases, up to a time when threadpool job is started - then in managed version UI elapsed time grows (in fact UI gets blocked and you cannot take any action). Timings of threadpool job speak for themselves.

ManagedNative

The sample code to reproduce the problem:

private int max = 2000;
private async void UIJob_Click(object sender, RoutedEventArgs e)
{
    IProgress<int> progress = new Progress<int>((p) => { MyProgressBar.Value = (double)p / max; });
    await Task.Run(async () => { await SomeUIJob(progress); });
}

private async Task SomeUIJob(IProgress<int> progress)
{
    Stopwatch watch = new Stopwatch();
    watch.Start();
    for (int i = 0; i < max; i++)
    {
        if (i % 100 == 0) { Debug.WriteLine($"     UI time elapsed => {watch.ElapsedMilliseconds}"); watch.Restart(); }
        await Task.Delay(1);
        progress.Report(i);
    }
}

private async void ThreadpoolJob_Click(object sender, RoutedEventArgs e)
{
    Debug.WriteLine("Firing on Threadpool");
    await Task.Run(() =>
   {
       double a = 0.314;
       Stopwatch watch = new Stopwatch();
       watch.Start();
       for (int i = 0; i < 50000000; i++)
       {
           a = Math.Sqrt(a) + Math.Sqrt(a + 1) + i;
           if (i % 10000000 == 0) { Debug.WriteLine($"Threadpool -> a value = {a} got in {watch.ElapsedMilliseconds} ms"); watch.Restart(); };
       }
   });
    Debug.WriteLine("Finished with Threadpool");
}

If you need a complete sample - then you can download it here.

As I've tested the difference appears on both optimized/non optimized code, in both debug and release versions.

Does anybody have an idea what can cause the problem?

Daguerre answered 7/1, 2016 at 22:15 Comment(5)
Might have to take a look at the emitted IL and machine code.Optimal
I work on the .NET Native Compiler and Runtime team. We usually use PerfView for these kinds of investigations. If you can collect some etl traces (one with .net native and one without) and sent them our way ([email protected]) we'll get someone to take a look at it.Gannet
Could be a thread pool starvation. Have you played with ThreadPool.SetMinThreads/SetMaxThreads?Kakalina
@Noseratio Seems like in UWP there is no option to control the number of threads.Daguerre
@Gannet I've send an e-mail at address you have mentioned. I've observed this mostly for app deployed on ARM device - is it possible to run perview for such process?Daguerre
G
14

This issue is caused because the “ThreadPool” math loop is causing GC starvation. Essentially, the GC has decided that it needs to run (due to wanting to do some interop allocation) and it’s trying to stop all of the threads to do collection/compaction. Unfortunately, we haven’t added the ability for .NET Native to hijack hot loops like the one you have below. This is briefly mentioned on Migrating Your Windows Store App to .NET Native page as:

Infinite looping without making a call (for example, while(true);) on any thread may bring the app to a halt. Similarly, large or infinite waits may bring the app to a halt.

One way to work around this is to add a call site into your loop (the GC is very happy to interrupt your thread when it’s trying to call another method!).

    for (long i = 0; i < 5000000000; i++)
           {
               MaybeGCMeHere(); // new callsite
               a = Math.Sqrt(a) + Math.Sqrt(a + 1) + i;
               if (i % 1000000000 == 0) { Debug.WriteLine($"Threadpool -> a value = {a} got in {watch.ElapsedMilliseconds} ms"); watch.Restart(); };
    }

...

    [MethodImpl(MethodImplOptions.NoInlining)] // need this so the callsite isn’t optimized away
    private void MaybeGCMeHere()
    {
    }

The downside is that you’ll have this “ugly” looking hack and you may suffer a bit from the added instructions. I've let some folks here know that this thing that we assumed was "vanishingly rare" is actually hit by a customer and we'll see what can be done about it.

Thanks for the report!

Update: We have made some big improvements around this scenario and will be able to hijack most long running threads for GC. These fixes will be available in the Update 2 set of UWP tools out probably in April? (I don't control the shipping schedule :-) )

Update update: The new tools are now available as part of UWP tools 1.3.1. We don't expect to have a perfect solution to threads aggressively fighting against being hijacked by the GC but I expect this scenario to be much better with the latest tools. Let us know!

Gannet answered 12/1, 2016 at 1:35 Comment(3)
Thanks for the whole team for taking care of this. One of your collegues said, that this will be corrected in the next VS update - that's great. I concur that it was harder for me to reproduce the issue on desktop, but on ARM I think it's a real scenario - in fact I've observed this in my app. I have a method that deal with photo and does some math operations on pixels, as it's cpu consuming, it's redirected to threadpool, this is where I've spotted the problem. Thank you once again.Daguerre
I've also edited little your answer and made the MSDN link a bold one - there is a chance that this may help someone to save some time.Daguerre
The edits are great! My SO markup isn't great so I really appreciate it! It does sound like we'll have some fixes for this kind of thing in Update 2.Gannet

© 2022 - 2024 — McMap. All rights reserved.