How to debug javascript as a popup window loads?
Asked Answered
B

7

21

What is the most effective way to debug JavaScript code that runs in a popup window? Specifically I need to trace what is happening as the page loads.

This is for SCORM 1.2 courses running in an LMS, which depends on other JavaScript objects in a parent window, so debugging the popup by itself won't work.

I could use a technique for other contexts though most of my time is debugging these courses.

I could use something like an option in the in-browser debugger that pauses on the first line of JavaScript that executes for a popup page, as if I put a breakpoint there. (I can't, or at least don't know how, to set breakpoints until well after the page has started)

Edit:

The debugger; statement works, but only for code I control. I sometimes need to trace JavaScript that runs as some popup window opens, and can't add breakpoints because the code has already run.

Battlement answered 2/10, 2012 at 18:20 Comment(1)
Same problem and SCORM situation too! If the window.open() call gives the new window a "name", then it will target that tab/window if it already exists. You simply need to get a tab/window open with the matching name and devtools open BEFORE going through the steps that open the window.Flageolet
C
17

You can put the magic

debugger;

statement anywhere into your javascript code (every debugger I know about will halt there by automatically setting a breakpoint at that line).

If that doesn't help either, I'd just "open that page in a new window / tab" and setting up breakpoints myself or also using debugger;

Canton answered 2/10, 2012 at 18:24 Comment(4)
I can do that in my specific case, since the first thing that runs is something I control, but I frequently need to trace script that I can't modify. The effect I'm looking for is to set a breakpoint at the first line of code the popup window hits, but by the time I launch the debugger it's already run and I can't step through.Battlement
@DanNovak: well, all you need to do is to intercept/hold the last javascript code line you're in control of. Before that 3rd party script is going to launch (I'm actually asking myself whats the purpose on debugging if you don't have access.. but whatever).Canton
Two things: (1) I've peppered my code with the debugger; call and it's just not working when the file is part of a pop-up window. And (2) debugging code you don't have access to is sometimes essential when you need to tell a client why a problem is clearly within their code and out of your control.Blight
The above solution does not work because the popup starts without the debugger console running. So the debugger; command is ignored.Farquhar
E
7

As of 2016, Chrome now has this as an option in the ChromeDevTools Settings

https://twitter.com/chromedevtools/status/697993811696291842?lang=en

Euh answered 14/12, 2018 at 19:14 Comment(0)
B
6

Expanding on @jAndy's answer, I've found Fiddler's AutoResponder to be an effective way to put in debugger; statements or other useful calls in code you don't control.

Something like:

  1. Clear your cache before you start.
  2. Run the site, allowing all the files you want to work with to load.
  3. Identify a request you want to tamper with, e.g. a JavaScript file you want to debug.
  4. Export that session from Fiddler to a local file.
  5. Edit the local file to add debugger; statements or whatever.
  6. Back in fiddler, select the request again, then the AutoResponder tab.
  7. Select 'Add Rule', which will create a new Rule for that exact URL by default.
  8. In the combo box at the bottom, select Find a file.. then browse to the file you tampered with.
  9. Be sure "Enable automatic responses" and "Unmatched requests passthrough" up top are checked.
  10. Clear cache again in your browser, then restart the site or page you're trying to debug.

Now, the browser will load the local version of the file instead of from the site. There may be other ways to substitute a local file for a remote URL in the browser (Charles has something like AutoResponder and Proxomitron may as well, I don't know if there's e.g. a browser addon to do that, but stuff like Greasemonkey may also work).

Battlement answered 15/8, 2014 at 0:17 Comment(0)
R
2

In Chrome: load the popup, while it is still loading, get it focused, quickly press F12 (open developer tool), then F8.

Reynalda answered 31/10, 2013 at 3:11 Comment(1)
Unfortunately, it doesn't work with chrome extension popups.Translocate
P
1

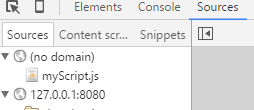
In Chrome you can append // @sourceURL=myScriptName.js to end of your script then,it loads in Sources tab in Chrome's Inspect when popup opens.

Refer to Debugging JavaScript

Also if you are using ASP.NET MVC, you can append @{Write("//@ sourceURL=myScriptName.js");} and the of your scripts that is inside in your *.cshtml files.

Chrome Inspect

Portiaportico answered 21/1, 2016 at 10:9 Comment(1)
This is very helpful as normally js files are hidden even when you inspect the popup html. Thanks!Accrue
B
0

I would recommend outputting information to the console via the console function. You can then see this information in a debugging tool such as Firebug for Firefox, or the built in ones in Chrome. Alternatively, you could always use alert for debugging.

Or maybe I am not understanding something about your question....

Blah answered 2/10, 2012 at 18:22 Comment(0)
E
0

This was the only way that seemed to work for me:

  --- CONTEXT: CODE EDITOR ------
  1.) Put this line at the top of the .js file to be debugged (will cause breakpoint as soon as the file is opened by the browser):
      debugger;
  2.) Push the new code to the server.   
  
  --- CONTEXT: CHROME Browser ------
  1.) Close all the Chrome browser windows except 1 window, 1 tab
  2.) Close Chrome browser (Chrome / Quit)
  3.) From the COMMAND LINE in MAC... 
      /Applications/Google\ Chrome.app/Contents/MacOS/Google\ Chrome --auto-open-devtools-for-tabs
      (this will open Chrome and every window / tab that opens will open the debugger)
  4.) Open Chrome browser (1 window, 1 tab appears)
  5.) Enter link where the debugger line of code was added in step 1 
        (Debugger should stop on first line of Javascript content) 
Eleemosynary answered 1/3, 2022 at 21:24 Comment(0)

© 2022 - 2024 — McMap. All rights reserved.