How to debug Java OutOfMemory exceptions?
Asked Answered
K

8

21

What is the best way to debug java.lang.OutOfMemoryError exceptions?

When this happens to our application, our app server (Weblogic) generates a heap dump file. Should we use the heap dump file? Should we generate a Java thread dump? What exactly is the difference?


Update: What is the best way to generate thread dumps? Is kill -3 (our app runs on Solaris) the best way to kill the app and generate a thread dump? Is there a way to generate the thread dump but not kill the app?

Kisor answered 22/12, 2010 at 18:1 Comment(2)
Do you mean it generates a .hprof file, or something else?Coefficient
A heapdump in phd formatKisor
C
14

Analyzing and fixing out-of-memory errors in Java is very simple.

In Java the objects that occupy memory are all linked to some other objects, forming a giant tree. The idea is to find the largest branches of the tree, which will usually point to a memory leak situation (in Java, you leak memory not when you forget to delete an object, but when you forget to forget the object, i.e. you keep a reference to it somewhere).

Step 1. Enable heap dumps at run time

Run your process with -XX:+HeapDumpOnOutOfMemoryError -XX:HeapDumpPath=/tmp

(It is safe to have these options always enabled. Adjust the path as needed, it must be writable by the java user)

Step 2. Reproduce the error

Let the application run until the OutOfMemoryError occurs.

The JVM will automatically write a file like java_pid12345.hprof.

Step 3. Fetch the dump

Copy java_pid12345.hprof to your PC (it will be at least as big as your maximum heap size, so can get quite big - gzip it if necessary).

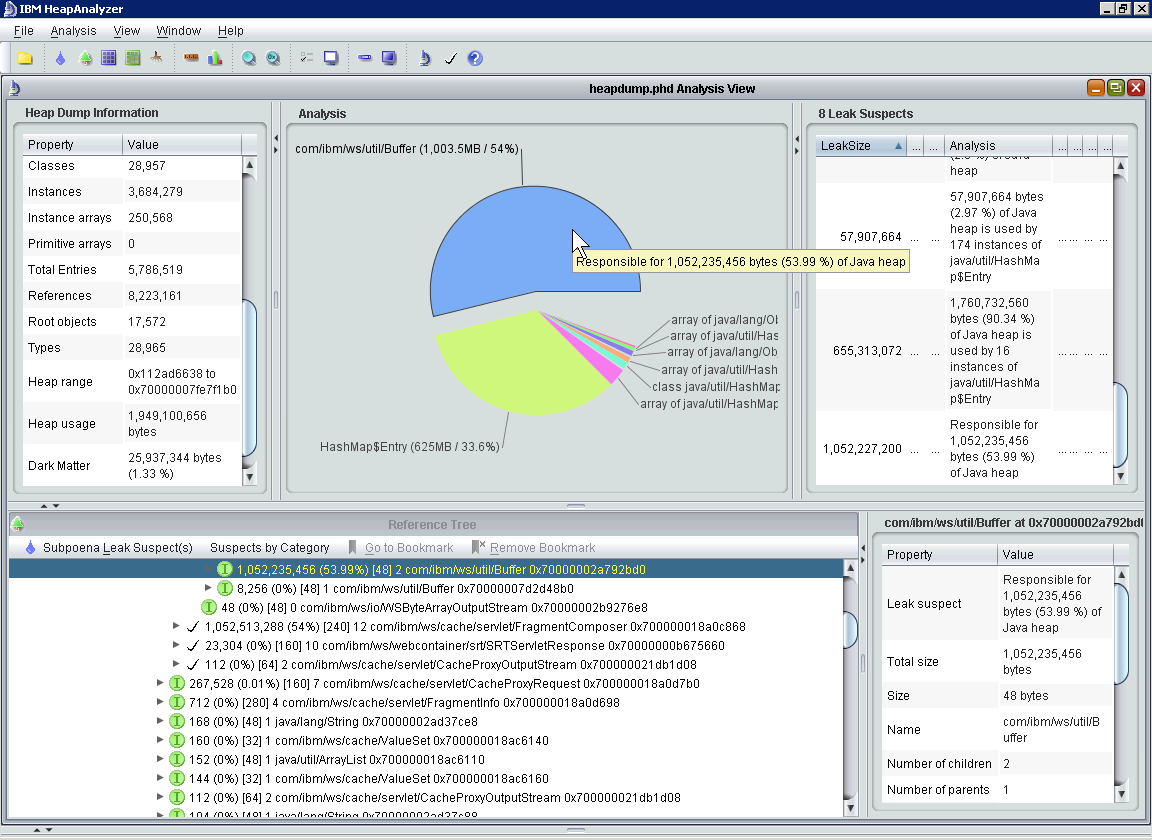
Step 4. Open the dump file with IBM's Heap Analyzer or Eclipse's Memory Analyzer

The Heap Analyzer will present you with a tree of all objects that were alive at the time of the error. Chances are it will point you directly at the problem when it opens.

IBM HeapAnalyzer

Note: give HeapAnalyzer enough memory, since it needs to load your entire dump!

java -Xmx10g -jar ha456.jar

Step 5. Identify areas of largest heap use

Browse through the tree of objects and identify objects that are kept around unnecessarily.

Note it can also happen that all of the objects are necessary, which would mean you need a larger heap. Size and tune the heap appropriately.

Step 6. Fix your code

Make sure to only keep objects around that you actually need. Remove items from collections in a timely manner. Make sure to not keep references to objects that are no longer needed, only then can they be garbage-collected.

Circumscissile answered 11/1, 2019 at 9:49 Comment(0)
F
7

I've had success using a combination of Eclipse Memory Analyzer (MAT) and Java Visual VM to analyze heap dumps. MAT has some reports that you can run that give you a general idea of where to focus your efforts within your code. VisualVM has a better interface (in my opinion) for actually inspecting the contents of the various objects that you are interested in examining. It has a filter where you can have it display all instances of a particular class and see where they are referenced and what they reference themselves. It has been a while since I've used either tool for this they may have a closer feature set now. At the time using both worked well for me.

Foss answered 22/12, 2010 at 18:55 Comment(1)
These are the tools I use too. I prefer MAT because it needs much less memory to load big heap dumps than VisualVM, even if I have to agree that VisualVM interface is easier to use.Podiatry
L
6

What is the best way to debug java.lang.OutOfMemoryError exceptions?

The OutOfMemoryError describes type of error in the message description. You have to check the description of the error message to handle the exception.

There are various root causes for out of memory exceptions. Refer to Oracle documentation page for more details.

java.lang.OutOfMemoryError: Java heap space:

Cause: The detail message Java heap space indicates object could not be allocated in the Java heap.

java.lang.OutOfMemoryError: GC Overhead limit exceeded:

Cause: The detail message "GC overhead limit exceeded" indicates that the garbage collector is running all the time and Java program is making very slow progress

java.lang.OutOfMemoryError: Requested array size exceeds VM limit:

Cause: The detail message "Requested array size exceeds VM limit" indicates that the application (or APIs used by that application) attempted to allocate an array that is larger than the heap size.

java.lang.OutOfMemoryError: Metaspace:

Cause: Java class metadata (the virtual machines internal presentation of Java class) is allocated in native memory (referred to here as metaspace)

java.lang.OutOfMemoryError: request size bytes for reason. Out of swap space?:

Cause: The detail message "request size bytes for reason. Out of swap space?" appears to be an OutOfMemoryError exception. However, the Java HotSpot VM code reports this apparent exception when an allocation from the native heap failed and the native heap might be close to exhaustion

java.lang.OutOfMemoryError: Compressed class space

Cause: On 64-bit platforms a pointer to class metadata can be represented by a 32-bit offset (with UseCompressedOops). This is controlled by the command line flag UseCompressedClassPointers (on by default).

If the UseCompressedClassPointers is used, the amount of space available for class metadata is fixed at the amount CompressedClassSpaceSize. If the space needed for UseCompressedClassPointers exceeds CompressedClassSpaceSize, a java.lang.OutOfMemoryError with detail Compressed class space is thrown.

Should we use the heap dump file? Should we generate a Java thread dump? What exactly is the difference?

Yes. You can use this heap heap dump file to debug the issue using profiling tools like visualvm or mat You can use Thread dump to get further insight about status of threads.

What is the best way to generate thread dumps? Is kill -3 (our app runs on Solaris) the best way to kill the app and generate a thread dump? Is there a way to generate the thread dump but not kill the app?

kill -3 <process_id> generates Thread dump and this command does not kill java process.

Lesbos answered 19/5, 2016 at 15:32 Comment(0)
W
3

It is generally very difficult to debug OutOfMemoryError problems. I'd recommend using a profiling tool. JProfiler works pretty well. I've used it in the past and it can be very helpful, but I'm sure there are others that are at least as good.

To answer your specific questions:

A heap dump is a complete view of the entire heap, i.e. all objects that have been created with new. If you're running out of memory then this will be rather large. It shows you how many of each type of object you have.

A thread dump shows you the stack for each thread, showing you where in the code each thread is at the time of the dump. Remember that any thread could have caused the JVM to run out of memory but it could be a different thread that actually throws the error. For example, thread 1 allocates a byte array that fills up all available heap space, then thread 2 tries to allocate a 1-byte array and throws an error.

Warford answered 22/12, 2010 at 18:8 Comment(0)
N
3

You can also use jmap/jhat to attach to a running Java process. These (family of) tools are really useful if you have to debug a live running application.

You can also leave jmap running as a cron task logging into a file which you can analyse later (It is something which we have found useful to debug a live memory leak)

jmap -histo:live <pid> | head -n <top N things to look for> > <output.log>

Jmap can also be used to generate a heap dump using the -dump option which can be read through the jhat.

See the following link for more details http://www.lshift.net/blog/2006/03/08/java-memory-profiling-with-jmap-and-jhat

Here is another link to bookmark http://java.sun.com/developer/technicalArticles/J2SE/monitoring/

Nibelung answered 22/12, 2010 at 20:43 Comment(1)
jstack should print the stack trace of a java process. download.oracle.com/javase/1.5.0/docs/tooldocs/share/…Nibelung
B
2

It looks like IBM provides a tool for analyzing those heap dumps: http://www.alphaworks.ibm.com/tech/heaproots ; more at http://www-01.ibm.com/support/docview.wss?uid=swg21190476 .

Bonaventure answered 22/12, 2010 at 18:9 Comment(0)
N
1

Once you get a tool to look at the heap dump, look at any thread that was in the Running state in the thread stack. Its probably one of those that got the error. Sometimes the heap dump will tell you what thread had the error right at the top.

That should point you in the right direction. Then employ standard debugging techniques (logging, debugger, etc) to hone in on the problem. Use the Runtime class to get the current memory usage and log it as the method in or process in question executes.

Nazario answered 22/12, 2010 at 18:29 Comment(2)
In general, finding the thread that got the OutOfMemoryError is not helpful. Sure, it was the straw that broke the camels neck, but is that last straw always the one to blame? Also, "standard debugging techniques" will help you little if you can not reliably reproduce the problem.Speedboat
In my experience (which to toot my own horn is pretty considerable), the OutOfMemoryError generally does occur in the method that is causing the problem. Of course you are correct, its not always the case. But because Java doesn't really suffer from much from memory leaks, these kinds of errors are often due to some heavy processing (text or XML) that is executing in a single Thread and that will be the same one that gets the error. But you are right, other "innocent" threads could get the error.Nazario
T
1

I generally use Eclipse Memory Analyzer. It displays the suspected culprits (the objects which are occupying most of the heap dump) and different call hierarchies which is generating those objects. Once that mapping is there we can go back to the code and try to understand if there is any possible memory leak any where in the code path.

However, OOM doesn't always mean that there is a memory leak. It's always possible that the memory needed by an application during the stable state or under load is not available in the hardware/VM. For example, there could be a 32 bit Java process (max memory used ~ 4GB) where as the VM has just 3 GB. In such a case, initially the application may run fine, but OOM may be encountered as and when the memory requirement approaches 3GB.

As mentioned by others, capturing thread dump is not costly, but capturing heap dump is. I have observed that while capturing heap dump application (generally) freezes and only a kill followed by restart helps to recover.

Tawny answered 5/5, 2015 at 16:37 Comment(0)

© 2022 - 2024 — McMap. All rights reserved.