Set a column as Column Index Pandas Dataframe [duplicate]
Asked Answered
P

2

0

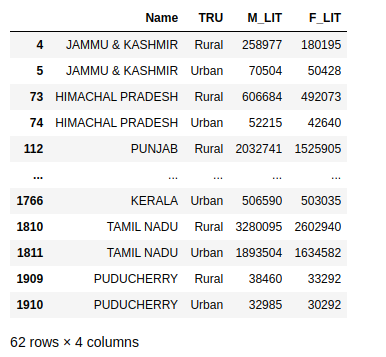
enter image description here

Let's say I have this data set and for analysing the trends between male and female literacy across rural and urban region of every state . I need to set index as Name Which I can do as -

df.set_index('Name',inplace=True)

Now I want to segregate my data into Rural and Urban And expect the ouput as - enter image description here
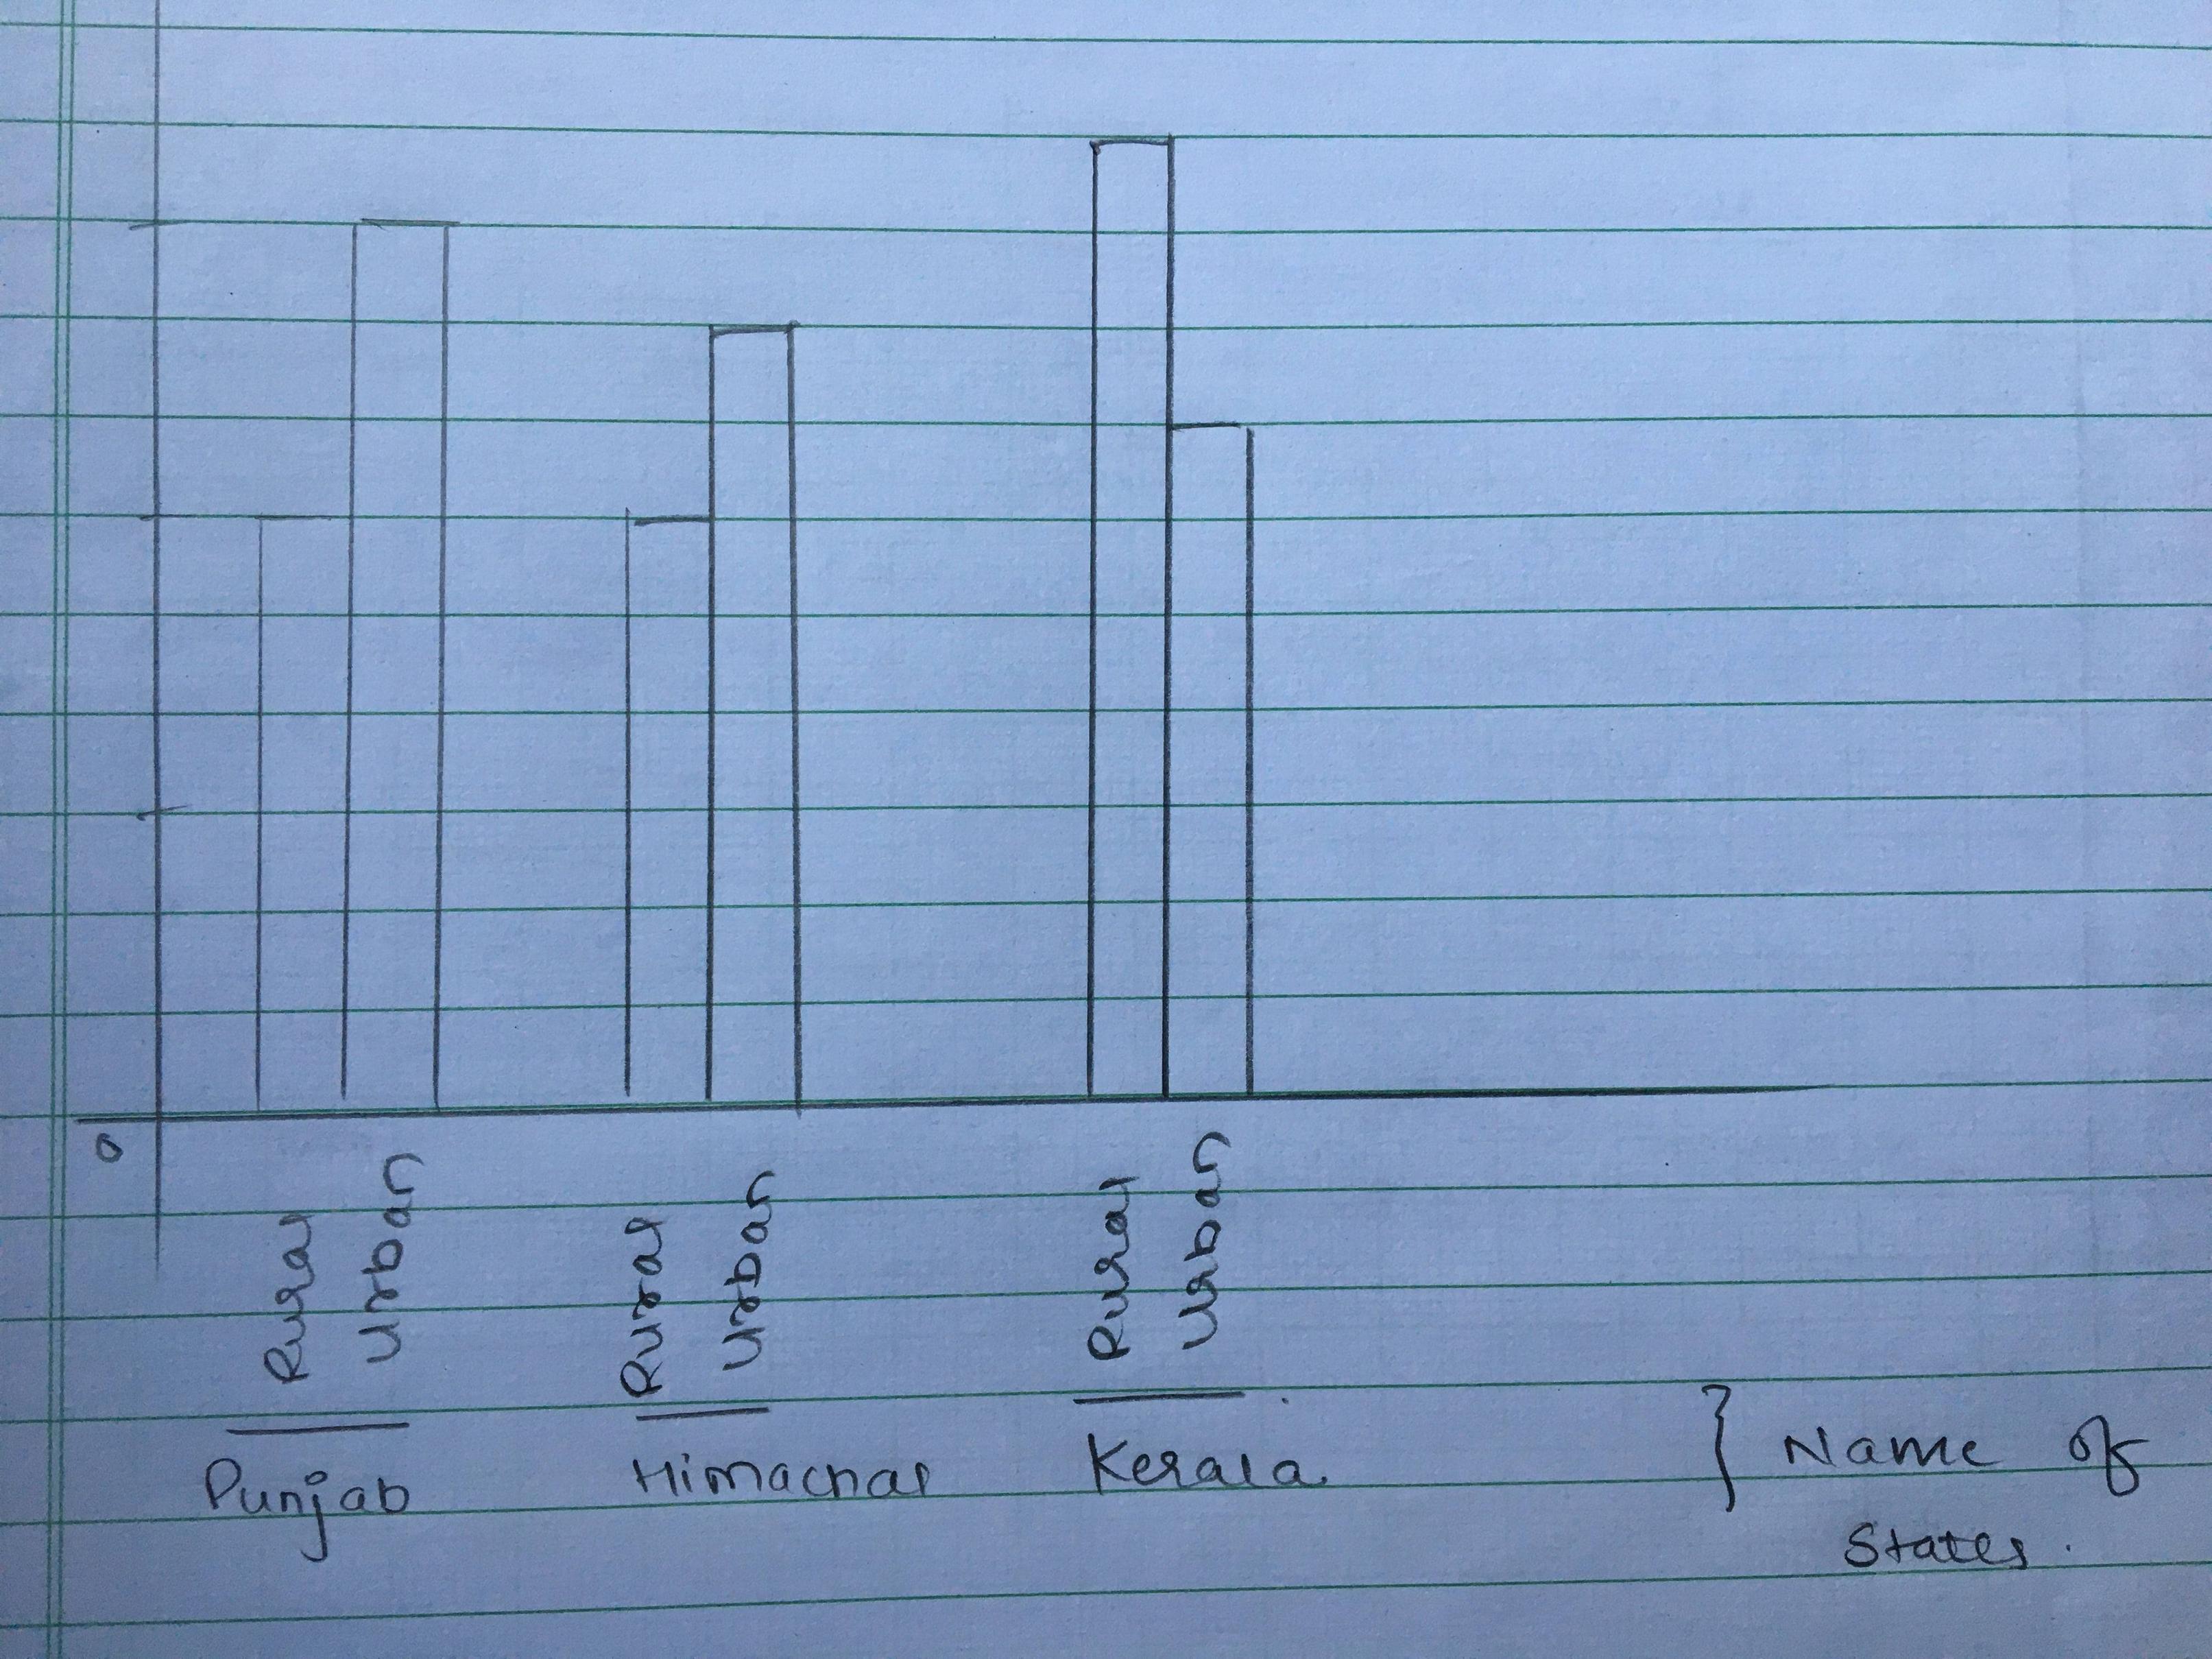
How can I acheive this ?

EDIT: I tried doing it using groupby

Literacy_States=Literacy_States.groupby(['Name','TRU'])['M_LIT','F_LIT'].count().unstack('TRU').plot.bar()

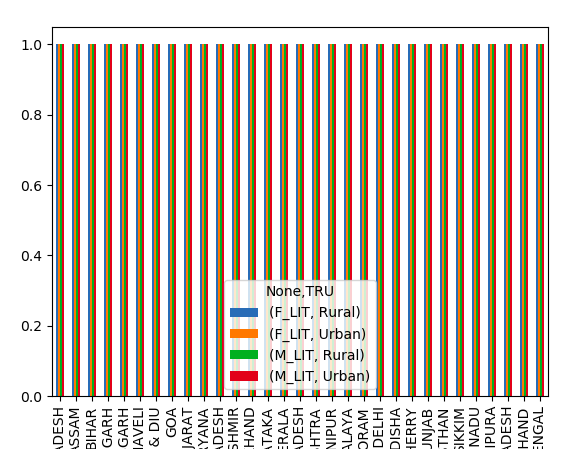
But ouput is : enter image description here

Pedicular answered 1/12, 2020 at 2:7 Comment(1)
Look into pivot, #53998362Emrick
T
0

You can have a look here: Matplotlib bar chart that displays the x values for male and females

Instead of Male and Females, you have: Rural and Urban.

Transilient answered 1/12, 2020 at 2:17 Comment(4)
I tried doing it -pd.pivot_table(Literacy_States,values=['M_LIT','F_LIT'],index='Name',columns='TRU',aggfunc ='count').plot.bar() but graph isn't one. Please check the answer as I have includedPedicular
Well the link didn't seem to help ,Pedicular
You didn't do exactly what is said in my suggestion. check again your code, you have to group by 'TRU'.Transilient
okay , what do I have to unstack ? I am not getting itPedicular
S
0

So what you can do is use a conditional statement to check whether TRU is rural or urban. Then throw that into a data structure- a list would do which would also make it easy to plot. Let me know if you have any questions or need further clarification!

Sheba answered 1/12, 2020 at 2:19 Comment(1)
I tried doing it -pd.pivot_table(Literacy_States,values=['M_LIT','F_LIT'],index='Name',columns='TRU',aggfunc ='count').plot.bar() but graph isn't one. Please check the answer as I have includedPedicular

© 2022 - 2024 — McMap. All rights reserved.