How to download only the selected columns in a dataframe using Colvis from DT in Shiny?
Asked Answered
S

2

0

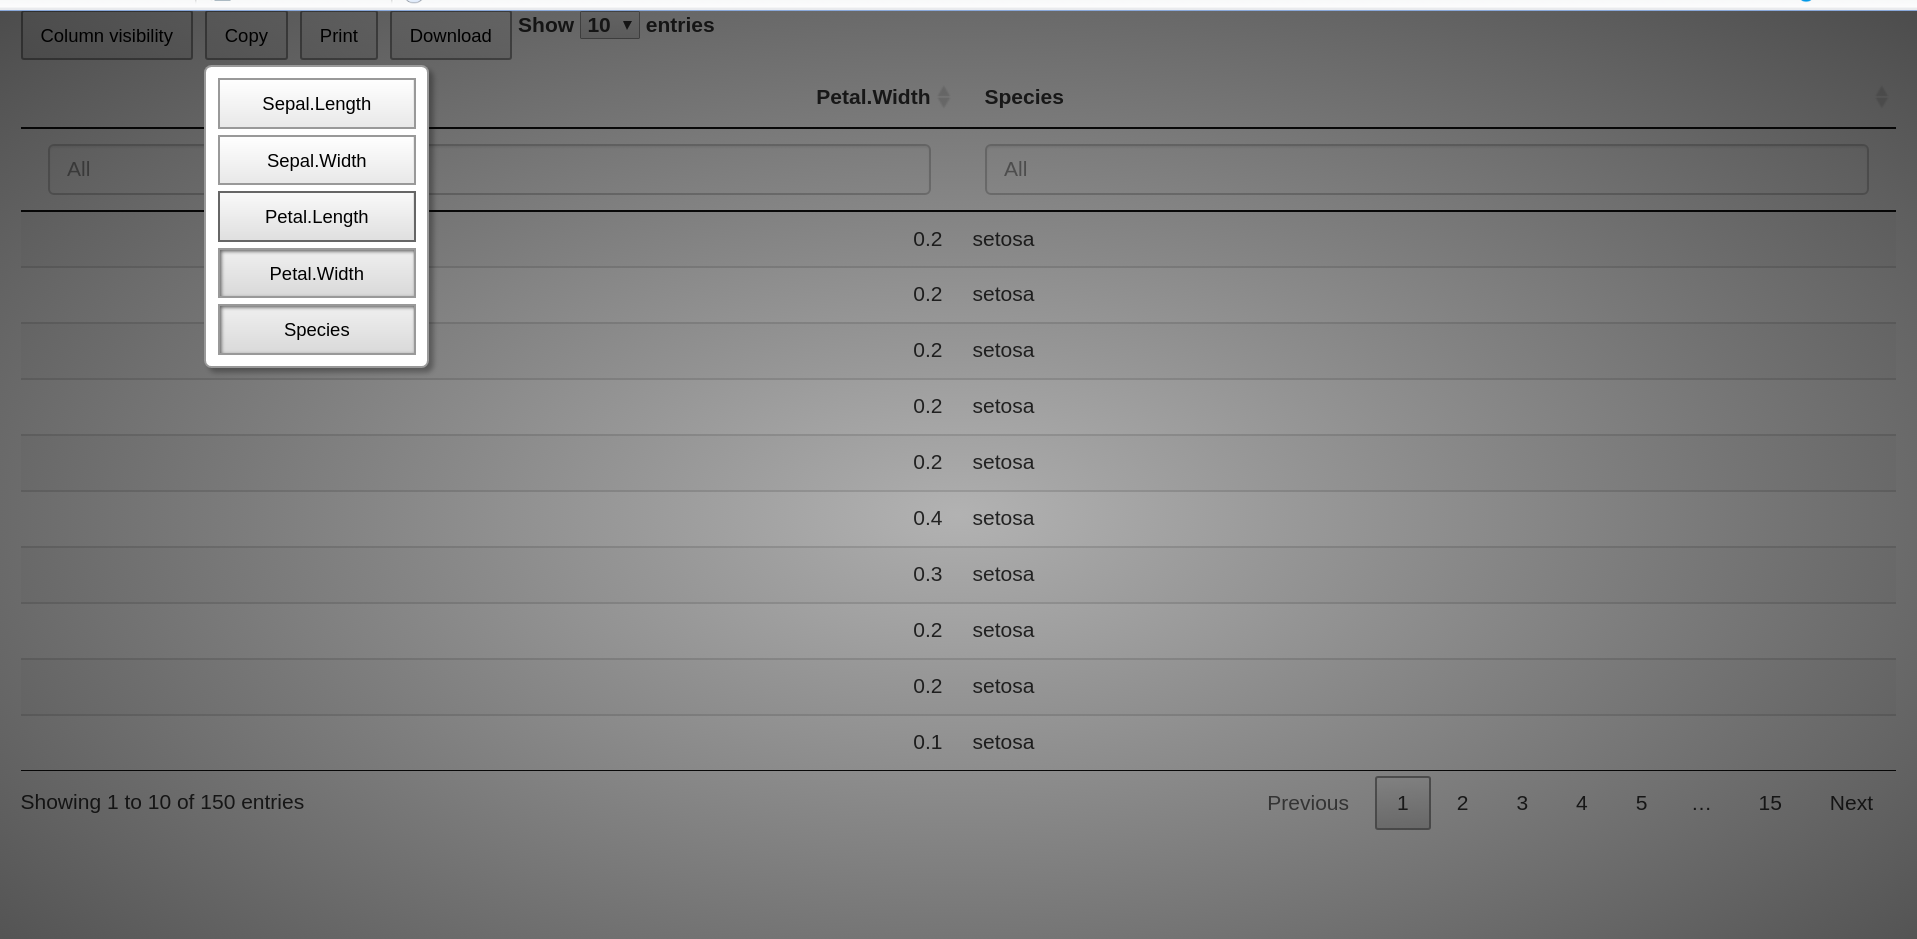
I am using the button colvis from the DT package to select which columns I would like to show in the table. Here you have more info about the button colvis. It works perfectly fine, it hides the columns that I don't want to select and the result is shown to the user.

image1

However, it seems that this info is not updated when I download the file.

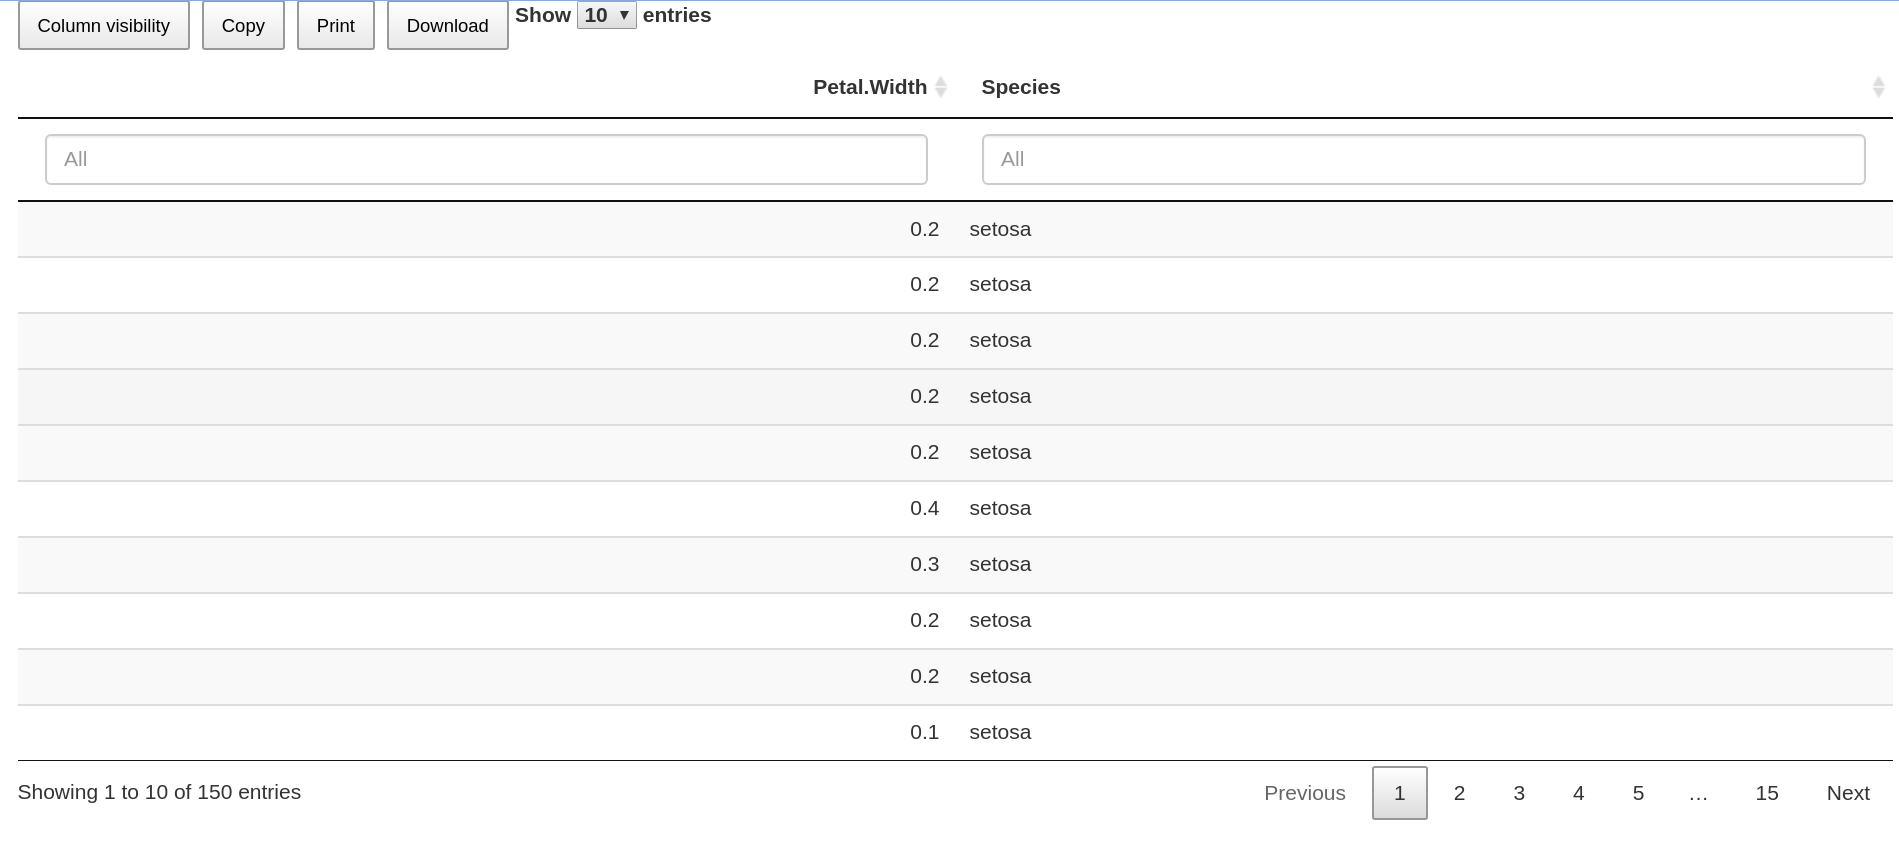
If I only select "Petal.Width" and "Species":

image 2

Then, I download the file... and I open it. I still have all the columns and not the selected ones.

image 3

I have been trying to find a solution, but I haven't found anything.

Does anyone know how to fix it?

Thanks in advance.

Here is my code:

library(shiny)
library(DT)

ui <- fluidPage(
  dataTableOutput("table")
)

server <- function(input, output, session) {
  output$table <- renderDataTable({
    datatable(
      iris,
      filter = list(position = 'top', clear = FALSE),
      selection = "none", #this is to avoid select rows if you click on the rows
      rownames = FALSE,
      extensions = 'Buttons',
      
      options = list(
        scrollX = TRUE,
        dom = 'Blrtip',
        buttons =
          list(I('colvis'),'copy', 'print', list(
            extend = 'collection',
            buttons = list(
              list(extend = 'csv', filename = paste0("iris"), title = NULL),
              list(extend = 'excel', filename = paste0("iris"), title = NULL)),
            text = 'Download'
          )),
        lengthMenu = list(c(10, 30, 50, -1),
                          c('10', '30', '50', 'All'))
      ),
      class = "display"
    )
  })
}

shinyApp(ui, server)
Simplehearted answered 20/5, 2022 at 10:19 Comment(0)
S
1

Thanks to Stéphane Laurent's answer, I managed to find an answer.

I had some problems to have both buttons (csv and excel) and how to organise the lists with the proposed solution, but I found the way to do it.

I will add the answer with the original code just in case someone has problems like me.

library(shiny)
library(DT)

ui <- fluidPage(
  dataTableOutput("table")
)

server <- function(input, output, session) {
  output$table <- renderDataTable({
    datatable(
      iris,
      filter = list(position = 'top', clear = FALSE),
      selection = "none", #this is to avoid select rows if you click on the rows
      rownames = FALSE,
      extensions = 'Buttons',
      
      options = list(
        scrollX = TRUE,
        dom = 'Blrtip',
        buttons =
          list(I('colvis'),'copy', 'print', list(
            extend = 'collection',
            text = 'Download',
            buttons = list(
              list(
                extend = "csv", filename = paste0("iris"), title=NULL,
                exportOptions = list(
                  columns = ":visible")
              ),
              
              list(
                extend = "excel", filename = paste0("iris"), title=NULL,
                exportOptions = list(
                  columns = ":visible")
              )
              
            )
          )),
        lengthMenu = list(c(10, 30, 50, -1),
                          c('10', '30', '50', 'All'))
      ),
      class = "display"
    )
  })
}

shinyApp(ui, server)
Simplehearted answered 20/5, 2022 at 11:4 Comment(0)
T
2
library(DT)

datatable(
  iris,
  extensions = "Buttons",
  options = list(
    dom = "Bfrtip",
    buttons = list(
      I("colvis"),
      list(
        extend = "collection",
        text = "Download",
        buttons = list(
          list(
            extend = "csv",
            exportOptions = list(
              columns = ":visible"
            )
          )
        )
      )
    )
  )
)
Tavares answered 20/5, 2022 at 10:45 Comment(0)
S
1

Thanks to Stéphane Laurent's answer, I managed to find an answer.

I had some problems to have both buttons (csv and excel) and how to organise the lists with the proposed solution, but I found the way to do it.

I will add the answer with the original code just in case someone has problems like me.

library(shiny)
library(DT)

ui <- fluidPage(
  dataTableOutput("table")
)

server <- function(input, output, session) {
  output$table <- renderDataTable({
    datatable(
      iris,
      filter = list(position = 'top', clear = FALSE),
      selection = "none", #this is to avoid select rows if you click on the rows
      rownames = FALSE,
      extensions = 'Buttons',
      
      options = list(
        scrollX = TRUE,
        dom = 'Blrtip',
        buttons =
          list(I('colvis'),'copy', 'print', list(
            extend = 'collection',
            text = 'Download',
            buttons = list(
              list(
                extend = "csv", filename = paste0("iris"), title=NULL,
                exportOptions = list(
                  columns = ":visible")
              ),
              
              list(
                extend = "excel", filename = paste0("iris"), title=NULL,
                exportOptions = list(
                  columns = ":visible")
              )
              
            )
          )),
        lengthMenu = list(c(10, 30, 50, -1),
                          c('10', '30', '50', 'All'))
      ),
      class = "display"
    )
  })
}

shinyApp(ui, server)
Simplehearted answered 20/5, 2022 at 11:4 Comment(0)

© 2022 - 2024 — McMap. All rights reserved.