Is there a way to tell Dot to use a cluster but not show the rectangle around the subgraph nodes?
You can do this with style.
Example using style=invis:
digraph g{
 subgraph cluster0 {
  style=invis;
  1 -> 2;
 }
}
If you'd like to use this as a default for all subgraphs, use subgraph[style=invis] :
digraph g{
 subgraph[style=invis];

 subgraph cluster0 {
  1 -> 2;
 }
}
Edit: 9 years later...
The best solution is to use
peripheries=0
This will actually prevent generating the rectangle in svg output, whereas penwidth=0 still includes a polygon (with stroke-width="0", but it's still there).
I've added this since this is the most upvoted answer.
peripheries=0 is better than penwidth=0. –
Shippy You can use style=invis:
subgraph cluster1 {
  style=invis
  ...
}
As an alternative to the style=invis approach above, you can also set pencolor=transparent (either locally or globally).
style=invis approach is no longer "above", i will edit the answer –
Statement style=invis, pencolor=transparent actually preserved the label of the subgraph. –
Plaudit This can be done by using the penwidth = 0 attribute. This neither affects the label text nor changes the bounding box of the cluster. Depending on the graphics driver this may output a zero width boundary. Using the suggested peripheries = 0 attribute forces the default rectangular surround to be removed as a side effect.
Although the style = invis and pencolor = transparent attributes work in most cases, there may be a need to avoid squashing the cluster label and leaving a transparent line around the cluster.
As noted by @marapet, peripheries=0 will remove the hairline from vector output formats like SVG that could be processed further.
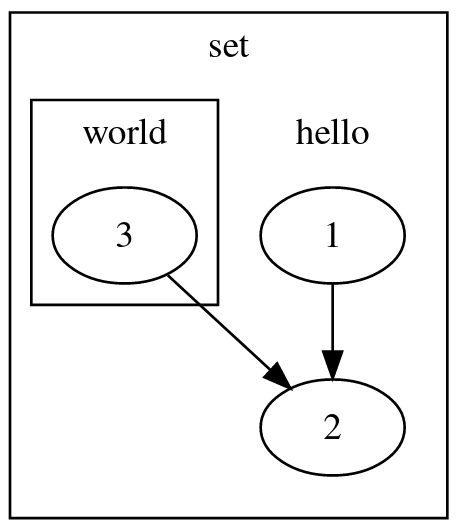
Use penwidth = 0 within subgraphs for which you don't want border.
This is how I am using it. It only removes the cluster border and does not cause any side effect as in with style = invis which also tends to removes the graph labels (undesired in my case).
digraph {
    subgraph cluster2 {
        label="set"

        subgraph cluster0 {
            penwidth = 0
            label="hello"
            1 -> 2;
        }

        subgraph cluster1 {
            //penwidth = 0
            label="world"
            3 -> 2;
        }
    }
}
check out the live preview here
<?xml version="1.0" encoding="UTF-8" standalone="no"?>
<!DOCTYPE svg PUBLIC "-//W3C//DTD SVG 1.1//EN"
"http://www.w3.org/Graphics/SVG/1.1/DTD/svg11.dtd">
<!-- Generated by graphviz version 2.40.1 (20161225.0304)
-->
<!-- Title: %0 Pages: 1 -->
<svg width="188pt" height="214pt" viewBox="0.00 0.00 188.00 213.60" xmlns="http://www.w3.org/2000/svg" xmlns:xlink="http://www.w3.org/1999/xlink">
<g id="graph0" class="graph" transform="scale(1 1) rotate(0) translate(4 209.6)">
<title>%0</title>
<polygon fill="#ffffff" stroke="transparent" points="-4,4 -4,-209.6 184,-209.6 184,4 -4,4"/>
<g id="clust1" class="cluster">
<title>cluster2</title>
<polygon fill="none" stroke="#000000" points="8,-8 8,-197.6 172,-197.6 172,-8 8,-8"/>
<text text-anchor="middle" x="90" y="-181" font-family="Times,serif" font-size="14.00" fill="#000000">set</text>
</g>
<g id="clust2" class="cluster">
<title>cluster0</title>
<polygon fill="none" stroke="#000000" stroke-width="0" points="94,-16 94,-164.8 164,-164.8 164,-16 94,-16"/>
<text text-anchor="middle" x="129" y="-148.2" font-family="Times,serif" font-size="14.00" fill="#000000">hello</text>
</g>
<g id="clust3" class="cluster">
<title>cluster1</title>
<polygon fill="none" stroke="#000000" points="16,-88 16,-164.8 86,-164.8 86,-88 16,-88"/>
<text text-anchor="middle" x="51" y="-148.2" font-family="Times,serif" font-size="14.00" fill="#000000">world</text>
</g>
<!-- 1 -->
<g id="node1" class="node">
<title>1</title>
<ellipse fill="none" stroke="#000000" cx="129" cy="-114" rx="27" ry="18"/>
<text text-anchor="middle" x="129" y="-109.8" font-family="Times,serif" font-size="14.00" fill="#000000">1</text>
</g>
<!-- 2 -->
<g id="node2" class="node">
<title>2</title>
<ellipse fill="none" stroke="#000000" cx="129" cy="-42" rx="27" ry="18"/>
<text text-anchor="middle" x="129" y="-37.8" font-family="Times,serif" font-size="14.00" fill="#000000">2</text>
</g>
<!-- 1->2 -->
<g id="edge1" class="edge">
<title>1->2</title>
<path fill="none" stroke="#000000" d="M129,-95.8314C129,-88.131 129,-78.9743 129,-70.4166"/>
<polygon fill="#000000" stroke="#000000" points="132.5001,-70.4132 129,-60.4133 125.5001,-70.4133 132.5001,-70.4132"/>
</g>
<!-- 3 -->
<g id="node3" class="node">
<title>3</title>
<ellipse fill="none" stroke="#000000" cx="51" cy="-114" rx="27" ry="18"/>
<text text-anchor="middle" x="51" y="-109.8" font-family="Times,serif" font-size="14.00" fill="#000000">3</text>
</g>
<!-- 3->2 -->
<g id="edge2" class="edge">
<title>3->2</title>
<path fill="none" stroke="#000000" d="M67.1617,-99.0816C78.3214,-88.7802 93.3334,-74.923 105.7715,-63.4417"/>
<polygon fill="#000000" stroke="#000000" points="108.1519,-66.0076 113.1259,-56.653 103.4039,-60.864 108.1519,-66.0076"/>
</g>
</g>
</svg>© 2022 - 2024 — McMap. All rights reserved.

