How to add black border to matplotlib 2.0 `ax` object In Python 3?
Asked Answered
T

3

22

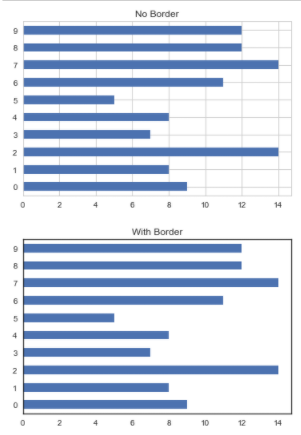
I've been using style sheets in matplotlib lately. I really like how clean the seaborn-white looks and I want to be able to add the border to other styles like ggplot or seaborn-whitegrid.

How can I add a black border around my ax object from fig, ax = plt.subplots()?

import pandas as pd
import numpy  as np
from collections import *

Se_data = pd.Series(Counter(np.random.randint(0,10,100)))
with plt.style.context("seaborn-whitegrid"):
    fig, ax = plt.subplots()
    Se_data.plot(kind="barh", ax=ax, title="No Border")
with plt.style.context("seaborn-white"):
    fig, ax = plt.subplots()
    Se_data.plot(kind="barh", ax=ax, title="With Border")

enter image description here

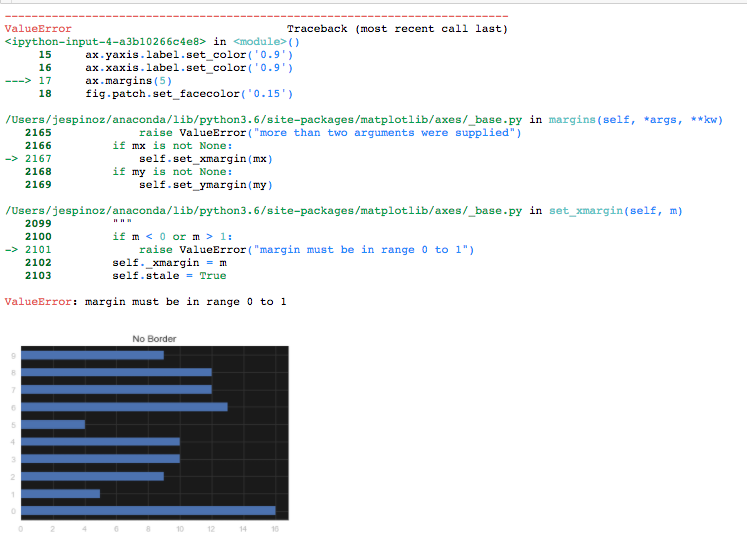
In response to the answer below:

Se_data = pd.Series(Counter(np.random.randint(0,10,100)))
with plt.style.context("seaborn-whitegrid"):
    fig, ax = plt.subplots()
    Se_data.plot(kind="barh", ax=ax, title="No Border")
    ax.spines['bottom'].set_color('0.5')
    ax.spines['top'].set_color(None)
    ax.spines['right'].set_color('0.5')
    ax.spines['left'].set_color(None)
    ax.patch.set_facecolor('0.1')
    plt.grid(b=True, which='major', color='0.2', linestyle='-')
    plt.grid(b=True, which='minor', color='0.2', linestyle='-')
    ax.tick_params(axis='x', colors='0.7', which='both')
    ax.tick_params(axis='y', colors='0.7', which='both')
    ax.yaxis.label.set_color('0.9')
    ax.xaxis.label.set_color('0.9')
    ax.margins(5)
    fig.patch.set_facecolor('0.15')

enter image description here

Town answered 6/4, 2017 at 21:4 Comment(4)
I think I'm missing something here. If you like the "seaborn-white" style, what's wrong with just using it instead of any other style?Lutherlutheran
I wanted to know how the borders are assigned so I can add it onto any plotTown
I think my answer below answers that. The borders are always there, just their color is more dark and the linewidth is thicker in the seaborn-white style.Lutherlutheran
The error you have in the updated version of the script is pretty self-explanatory, "margin must be [a number] in [the] range between 0 and 1". So don't use 5.Lutherlutheran
L
6

The difference between the seaborn-whitegrid and the seaborn-white styles are

seaborn-whitegrid

axes.grid: True
axes.edgecolor: .8
axes.linewidth: 1

seaborn-white

axes.grid: False
axes.edgecolor: .15
axes.linewidth: 1.25

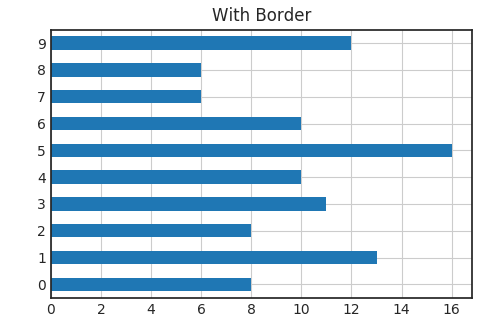
The following will thus provide identical plots:

import matplotlib.pyplot as plt
import pandas as pd
import numpy  as np
from collections import *

Se_data = pd.Series(Counter(np.random.randint(0,10,100)))
with plt.style.context("seaborn-whitegrid"):
    plt.rcParams["axes.edgecolor"] = "0.15"
    plt.rcParams["axes.linewidth"]  = 1.25
    fig, ax = plt.subplots()
    Se_data.plot(kind="barh", ax=ax, title="No Border")
with plt.style.context("seaborn-white"):
    plt.rcParams["axes.grid"] = True
    fig, ax = plt.subplots()
    Se_data.plot(kind="barh", ax=ax, title="With Border")

enter image description here

Lutherlutheran answered 6/4, 2017 at 22:38 Comment(1)
I had to add plt.rcParams["axes.grid"] = False in 'No Border' chart as my chart was apparently picking grid background as default.Preview
M
25

Take a look at this. What you're looking for are these two lines:

ax.patch.set_edgecolor('black')  

ax.patch.set_linewidth(1)  
Messy answered 28/4, 2019 at 16:31 Comment(1)
Instead of ax.patch.set_linewidth('1') , what worked for me was ax.patch.set_linewidth(1). It didn't accept a string as the width value.Ixtle
S
9

You probably want ax.spines.set_color()

These will give you a broad range of options for custom solutions:

ax.spines['bottom'].set_color('0.5')
ax.spines['top'].set_color(None)
ax.spines['right'].set_color('0.5')
ax.spines['left'].set_color(None)
ax.patch.set_facecolor('0.1')
plt.grid(b=True, which='major', color='0.2', linestyle='-')
plt.grid(b=True, which='minor', color='0.2', linestyle='-')
ax.tick_params(axis='x', colors='0.7', which='both')
ax.tick_params(axis='y', colors='0.7', which='both')
ax.yaxis.label.set_color('0.9')
ax.xaxis.label.set_color('0.9')
ax.margins(0.5)
fig.patch.set_facecolor('0.15')

For more details see: http://matplotlib.org/api/spines_api.html

Selfjustifying answered 6/4, 2017 at 21:23 Comment(4)
ax.margins(5) should have been ax.margins(0.5)Selfjustifying
The background is still black :/ and the borders go away once I change it to white.Town
I wasn't setting them to anything specific; 1.0 is white; 0.0 is black, everything else is gray scale in between. I left that for you to fiddle with to your needs; giving you the tools to customize.Selfjustifying
For ax.spines.set_color(), I needed to set each spine individually (as in your code block), eg [a.set_color("w") for a in ax.spines.values()].Firewarden
L
6

The difference between the seaborn-whitegrid and the seaborn-white styles are

seaborn-whitegrid

axes.grid: True
axes.edgecolor: .8
axes.linewidth: 1

seaborn-white

axes.grid: False
axes.edgecolor: .15
axes.linewidth: 1.25

The following will thus provide identical plots:

import matplotlib.pyplot as plt
import pandas as pd
import numpy  as np
from collections import *

Se_data = pd.Series(Counter(np.random.randint(0,10,100)))
with plt.style.context("seaborn-whitegrid"):
    plt.rcParams["axes.edgecolor"] = "0.15"
    plt.rcParams["axes.linewidth"]  = 1.25
    fig, ax = plt.subplots()
    Se_data.plot(kind="barh", ax=ax, title="No Border")
with plt.style.context("seaborn-white"):
    plt.rcParams["axes.grid"] = True
    fig, ax = plt.subplots()
    Se_data.plot(kind="barh", ax=ax, title="With Border")

enter image description here

Lutherlutheran answered 6/4, 2017 at 22:38 Comment(1)
I had to add plt.rcParams["axes.grid"] = False in 'No Border' chart as my chart was apparently picking grid background as default.Preview

© 2022 - 2024 — McMap. All rights reserved.