Creating curved edges with NetworkX in Python3
Asked Answered
F

4

22

I would like to use networkx (i would also like to take another framework if you know a better one) to create a graps whose nodes are at fixed positions. At the same time the edges of the graph should not overlap.

My previous code looks like this:

#!/usr/bin/env python3

import networkx as nx
import matplotlib.pyplot as plt

# Graph data
names = ['A', 'B', 'C', 'D', 'E']
positions = [(0, 0), (0, 1), (1, 0), (0.5, 0.5), (1, 1)]
edges = [('A', 'B'), ('A', 'C'), ('A', 'D'), ('A', 'E'), ('D', 'A')]

# Matplotlib figure
plt.figure('My graph problem')

# Create graph
G = nx.MultiDiGraph(format='png', directed=True)

for index, name in enumerate(names):
    G.add_node(name, pos=positions[index])

labels = {}
for edge in edges:
    G.add_edge(edge[0], edge[1])
    labels[(edge[0], edge[1])] = '{} -> {}'.format(edge[0], edge[1])

layout = dict((n, G.node[n]["pos"]) for n in G.nodes())
nx.draw(G, pos=layout, with_labels=True, node_size=300)
nx.draw_networkx_edge_labels(G, layout, edge_labels=labels)

plt.show()

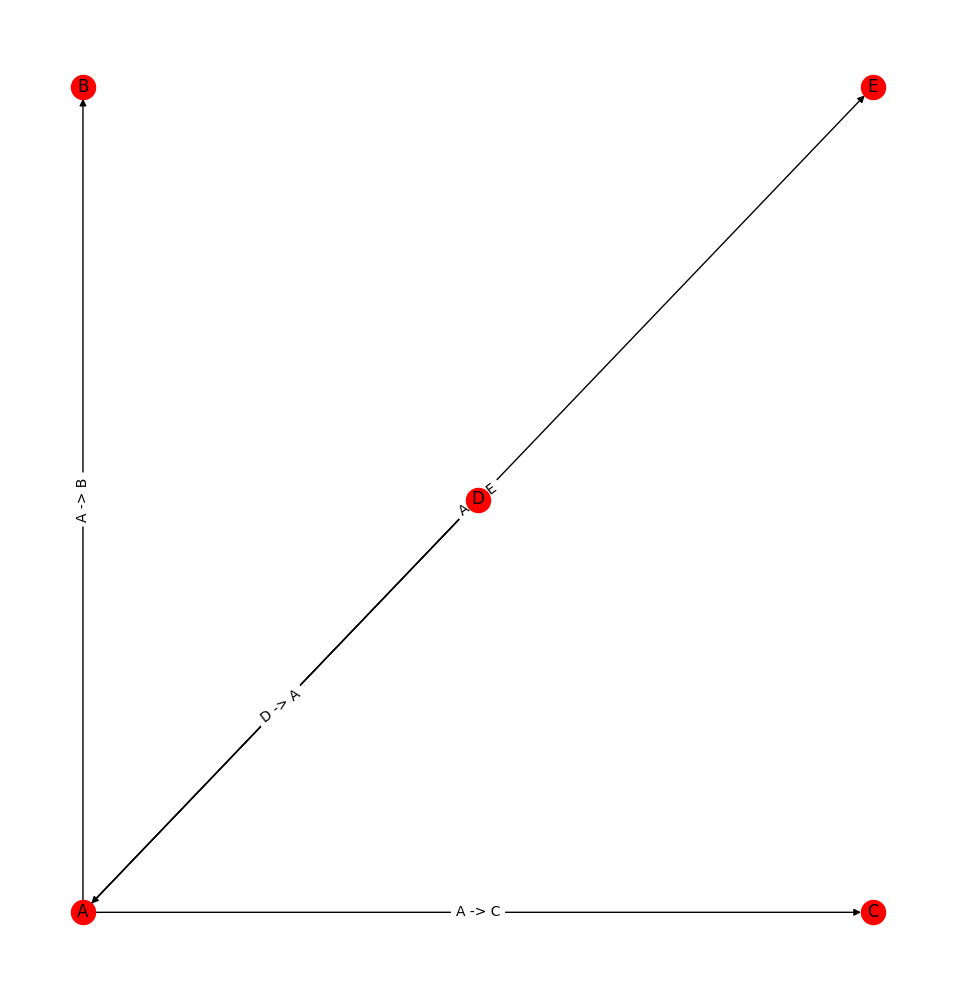
and gives the following result

enter image description here

How do I make sure that the edges are "rounded" so that they don't overlap?

Fever answered 1/10, 2018 at 9:47 Comment(7)
Sorry, cannot help here; the following setup.py leads to a segfault with your code. cairocffi==0.9.0 cffi==1.11.5 cycler==0.10.0 decorator==4.3.0 kiwisolver==1.0.1 matplotlib==3.0.0 networkx==2.2 numpy==1.15.2 pgi==0.0.11.2 pycparser==2.19 pyparsing==2.2.2 python-dateutil==2.7.3 six==1.11.0 would you mind to share yours?Airiness
comment formatting is the worst -.-'Airiness
Just do a pip install networkx && pip install matplotlibFever
Thanks, well meant i guess. But not what I need. I did what you suggest before, it lacks several dependencies. After installing them I run into segfaults. This is nothing I want to debug, so if you could just copy the setup.py you're using successfully, someone may help you without running in the same issues as me. While you're at it, which specific python version are you using? 3.5, 3.6, or 3.7?Airiness
Sorry, I must have misunderstood the question. I don't have setup.py, but the code runs under Python 3.6.6 without any problems in a virtual environment. A setup with the following steps works for me: mkdir graph_stack_tmp python3 -m venv graph_stack_tmp cd graph_stack_tmp source bin/activate pip install networkx matplotlib <execute my code now>Fever
AFAIK, it's currently not possible to draw a graph with curved edges with networkx although it would not be too difficult to modify the source code to do so. networkx uses the FancyArrowPatch class from matplotlib to draw arrows in draw_networkx_edges (which is wrapped by draw). FancyArrowPatch supports a connectionstyle argument, which is not set by draw_networkx_edges; the default is a straight line, which is what you get at the moment. Given the quality of your MWE, I suspect that you will manage to clone the networkx github repo, and patch draw_networkx_edges.Beamy
Otherwise, I would suggest that you raise an issue on their github. If that fails, igraph supports curved edges, IIRC (might have been just for the R interface though I don't think that likely).Beamy
O
34

In other NetworkX news, YOU CAN NOW specify a connectionstyle parameter to nx.draw_networkx_edges. For example, if I want a network with curved edges I can write:

# Compute position of nodes
pos = nx.kamada_kawai_layout(G)

# Draw nodes and edges
nx.draw_networkx_nodes(G, pos)
nx.draw_networkx_edges(
    G, pos,
    connectionstyle="arc3,rad=0.1"  # <-- THIS IS IT
)

The make the edges more curvy, simply increase the x of "rad=x".

Note: the code won't produce this figure with all the colors and arrows, a little more code is necessary for that.

Orphaorphan answered 9/12, 2020 at 8:32 Comment(4)
I should also say, that for some reason this only seems to work when edges are directed. This is most certainly a bug and will probably be fixed when some decent person raises an issue and makes a PR on github.com/networkx/networkxOrphaorphan
It also works for G.draw if G is directed (at least in v.2.5).Mensa
This code snippet does not work for me with an undirected multigraph G.Demosthenes
@Demosthenes provide more info. What error message do you get? Which version of networkx are you running?Orphaorphan
B
5

the edges of the graph should not overlap

Using the connectionstyle parameter to plot arcs with a pre-determined curvature does not reduce edge-edge or node-edge overlaps.

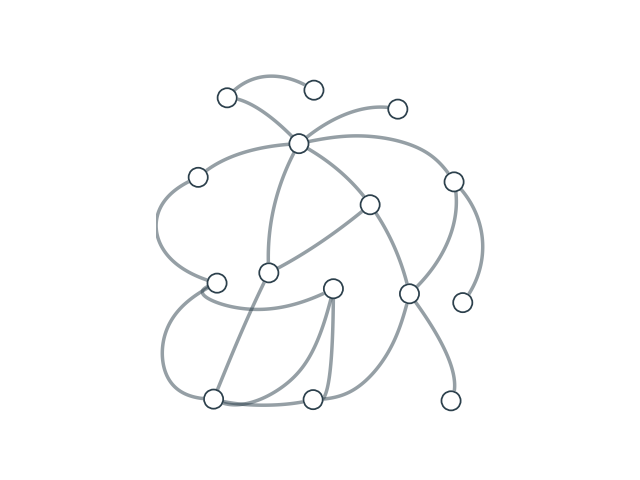
With straight edges, overlaps with other plot elements are often inevitable. However, if we are allowed to plot curved edges, we can route each edge such that it avoids other nodes and edges as much as possible. This effect can be achieved by inserting control points into each edge, effectively segmenting each edge into short sub-edges. We can then use the standard Fruchterman-Reingold algorithm (called spring_layout in networkx) to simulate the graph as a system of springs, where all nodes and control points repel each other but connected nodes and control points also attract each other. The positions of the (original) nodes are kept fixed, while we let the positions of the edge control points anneal to their equilibrium position.

I have an implementation of this approach here. The code is part of a python network plotting library called netgraph, of which I am the author. netgraph is fully compatible with networkx and igraph Graph objects, so it should be easy and fast to generate good looking graphs.

enter image description here

#!/usr/bin/env python
import matplotlib.pyplot as plt
import networkx as nx

from netgraph import Graph # pip install netgraph

g = nx.florentine_families_graph()
Graph(g, edge_layout='curved')
plt.show()
Beamy answered 8/6, 2021 at 14:36 Comment(1)
Great library! Exquisite documentation. Looking forward to using this.Orphaorphan
M
4

I don't think you can do this directly with networkx functions. But you can use matplotlib directly using the node positions you have calculated.

Adapting your code:

 import networkx as nx
import matplotlib.pyplot as plt

# Graph data
names = ['A', 'B', 'C', 'D', 'E']
positions = [(0, 0), (0, 1), (1, 0), (0.5, 0.5), (1, 1)]
edges = [('A', 'B'), ('A', 'C'), ('A', 'D'), ('A', 'E'), ('D', 'A')]

# Matplotlib figure
plt.figure('My graph problem')

# Create graph
G = nx.MultiDiGraph(format='png', directed=True)

for index, name in enumerate(names):
    G.add_node(name, pos=positions[index])

labels = {}


layout = dict((n, G.node[n]["pos"]) for n in G.nodes())
nx.draw(G, pos=layout, with_labels=True, node_size=300)
ax = plt.gca()
for edge in edges:
    ax.annotate("",
                xy=layout[edge[0]], xycoords='data',
                xytext=layout[edge[1]], textcoords='data',
                arrowprops=dict(arrowstyle="->", color="0.5",
                                shrinkA=5, shrinkB=5,
                                patchA=None, patchB=None,
                                connectionstyle="arc3,rad=-0.3",
                                ),
                )
plt.show()

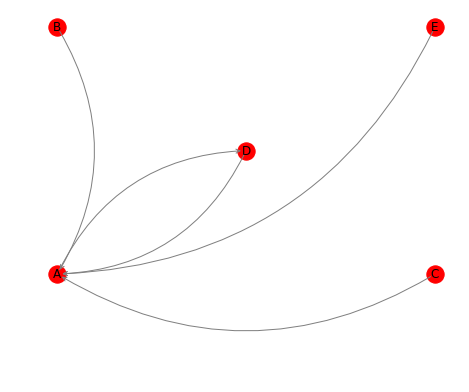
Gives:

enter image description here

See also this.

Masurium answered 11/3, 2020 at 13:18 Comment(1)
Just tried it Colab, and, as it turns out, the MultiDiGraph implementation has changed. I had to use nodes (plural) instead of node in the following line: layout = dict((n, G.nodes[n]["pos"]) for n in G.nodes()) (<-- already corrected line; currently tested networkx version: 2.4).Eudemonism
F
1

As Paul mentions, there is now the option to use the FancyArrowPatch in draw_networkx_edges though it only works on directed graphs and is also very slow.

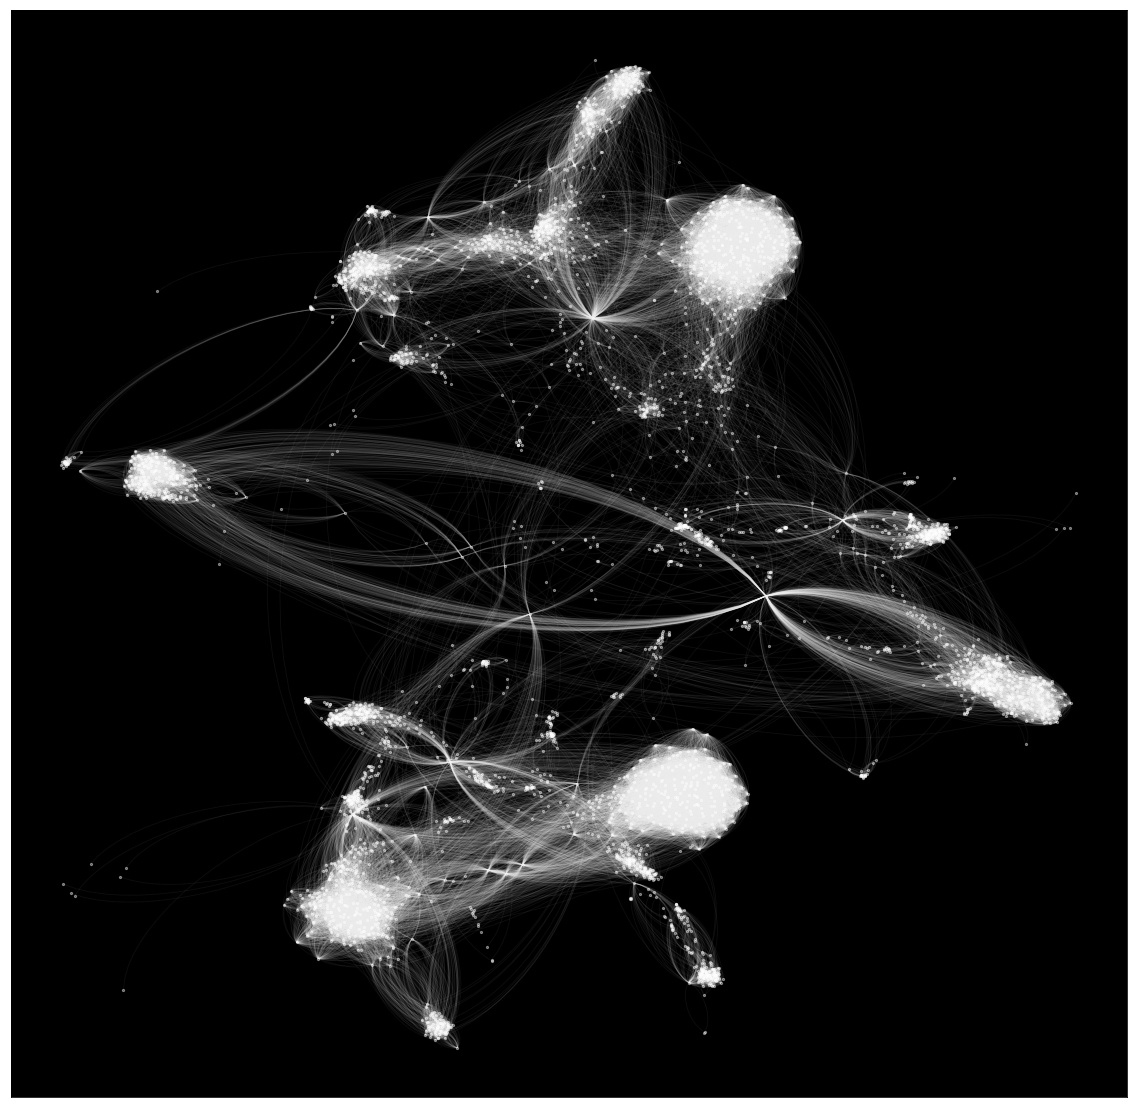
For what it's worth, I packaged up some old code I had which uses the bezier package to produce nice curved edges from a NetworkX graph (or any edge list, really) and plot them. It may be useful: https://github.com/beyondbeneath/bezier-curved-edges-networkx

Sample image, using the SNAP Facebook dataset and ForceAtlas2 layout:

enter image description here

Felicle answered 10/4, 2019 at 1:11 Comment(1)
Just tried passing connectionstyle='arc3, rad=0.1' to nx.draw() and it worked beautifully for my use case on a small(ish) graph.Springhalt

© 2022 - 2024 — McMap. All rights reserved.