Graphene-python performance issues for large data sets
Asked Answered
F

1

23

Currently using graphene-python with graphene-django (and graphene-django-optimizer).

After receiving a GraphQL query, the database query is successfully completed in a fraction of a second; however, graphene doesn't send a response for another 10+ seconds. If I increase the data being sent in the response, the response time increases linearly (triple the data = triple the response time).

The data being retrieved composed of nested objects, up to 7 layers deep, but with the optimized queries this doesn't impact the time taken to retrieve the data from the DB, so I'm assuming the delay has to do with graphene-python parsing the results into the GraphQL response.

I can't figure out how to profile the execution to determine what is taking so long -- running cProfiler on Django doesn't seem to be tracking the execution of graphene.

SQL Query response time was determined using the graphene-django-debugger middleware, results are shown below:

    "_debug": {
  "sql": [
    {
      "duration": 0.0016078948974609375,
      "isSlow": false,
      "rawSql": "SELECT SYSDATETIME()"
    },
    {
      "duration": 0.0014908313751220703,
      "isSlow": false,
      "rawSql": "SELECT [redacted]"
    },
    {
      "duration": 0.0014371871948242188,
      "isSlow": false,
      "rawSql": "SELECT [redacted]"
    },
    {
      "duration": 0.001291036605834961,
      "isSlow": false,
      "rawSql": "SELECT [redacted]"
    },
    {
      "duration": 0.0013201236724853516,
      "isSlow": false,
      "rawSql": "SELECT [redacted]"
    },
    {
      "duration": 0.0015559196472167969,
      "isSlow": false,
      "rawSql": "SELECT [redacted]"
    },
    {
      "duration": 0.0016672611236572266,
      "isSlow": false,
      "rawSql": "SELECT [redacted]"
    },
    {
      "duration": 0.0014820098876953125,
      "isSlow": false,
      "rawSql": "SELECT [redacted]"
    },
    {
      "duration": 0.0014810562133789062,
      "isSlow": false,
      "rawSql": "SELECT [redacted]"
    },
    {
      "duration": 0.001667022705078125,
      "isSlow": false,
      "rawSql": "SELECT [redacted]"
    },
    {
      "duration": 0.0014202594757080078,
      "isSlow": false,
      "rawSql": "SELECT [redacted]"
    },
    {
      "duration": 0.0027959346771240234,
      "isSlow": false,
      "rawSql": "SELECT [redacted]"
    },
    {
      "duration": 0.002704143524169922,
      "isSlow": false,
      "rawSql": "SELECT [redacted]"
    },
    {
      "duration": 0.0030939579010009766,
      "isSlow": false,
      "rawSql": "SELECT [redacted]"
    }
  ]
}

The screenshot below shows the server's corresponding response time for that same request: Screenshot of Chrome DevTool Network post response times
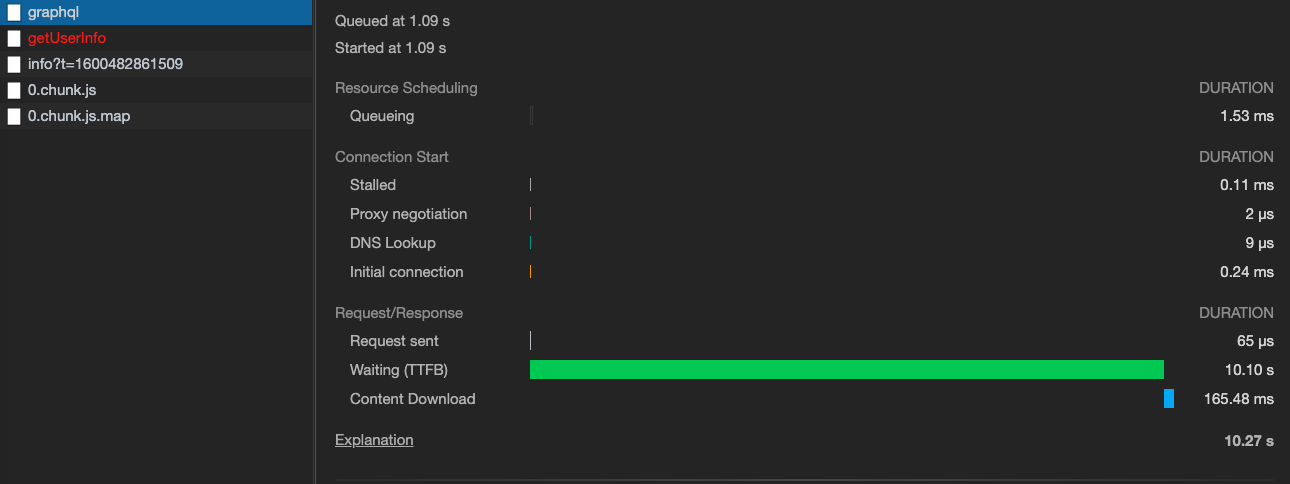
If anyone knows why graphene would take so long to create the response or could assist me with profiling the execution of graphene, I'd greatly appreciate it!

Foltz answered 19/9, 2020 at 2:37 Comment(9)
What is the graphql query?Bergmans
Update question with resolvers and types. GraphQL is known to perform slow on deeper relations.Fascine
I would also suspect it being a resolver issueBastard
How are you setting up the profiler? Could you try the WSGI profiling middleware from the Pallets Project werkzeug.palletsprojects.com/en/2.2.x/middleware/profilerFiore
Did you every figure out a solution, @techknowfile?Iceboat
In case the library maintainers come across. Consider adding streaming to the deserializers. That way even a million length queryset will be handled gracefully.Mercantilism
Hi, how big is a JSON payload your endpoint generates? I experienced a big performance regression when the size of response got bigger than a couple of megabytes. I didn't diagnosed a problem on my side and it turned out that python eat out a lot of resources while the serializing process. i end up caching data and even creating a separated server instances that handles big requests.Falsity
@IlyaKhrustalev I'm seeing this issue when the payload is ~1.5MB and contains ~10K objects.Iceboat
@Iceboat that volume definetely should not take so much.Falsity
P
1

Try using a better profiler like Silk, it will show you a breakdown based on queries Django fires to the DB, as well as a neat cProfiler overview. I would suspect an issue in extraneous DB calls. Graphene tends to make Django do a lot of per-field calls while constructing the response and they might not be showing up in the debugger response.

Without more information on the setup - models, resolvers and graphql queries - it's very hard to judge.

Edit: it's now clear from the question that the DB is not an issue

Phosphatase answered 4/11, 2022 at 10:50 Comment(3)
It is not DB related. Graphene takes an unusual amount of time serializing deeply nested querysets.Mercantilism
that was not evident from the question when posted, now it is, capturing more of the stack with more than just cprofiler is still a solid suggestion, graphene-django-debugger as per the question is ofc another good choice to check db call onlyPhosphatase
Since you have realized that, I would suggest more edit to your answer than what you have done so far.Mercantilism

© 2022 - 2024 — McMap. All rights reserved.