VueJS Stack Traces Do Not Show Where Errors Occur
Asked Answered
L

1

23

Context

Source Code

I am using VueJS with webpack in a project.

I am not using the vue-loader plugin or .vue files.

My project is structured like a standard Javascript webpack project which imports vue.

My webpack configuration has the following relevant options:

  • dev-tool: "source-map"
  • resolve.alias["vue$"] = "vue/dist/vue.js"

Source maps for my webpack Javascript bundle file are being generated.

Issue

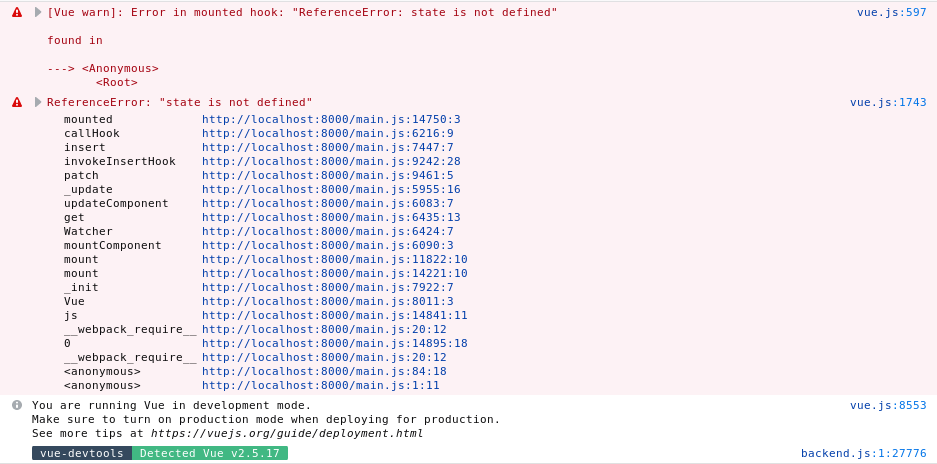
While programming an error showed up in the console. Unfortunately the stack trace shows the error as being in the vue.js file and later the webpack generated Javascript bundle file (main.js).

Vue Error

It looks like the source map generated for my Javascript bundle by webpack is not working properly.

I found several related issues, however these issues seem to be related to the vue-loader webpack plugin which I do not use.

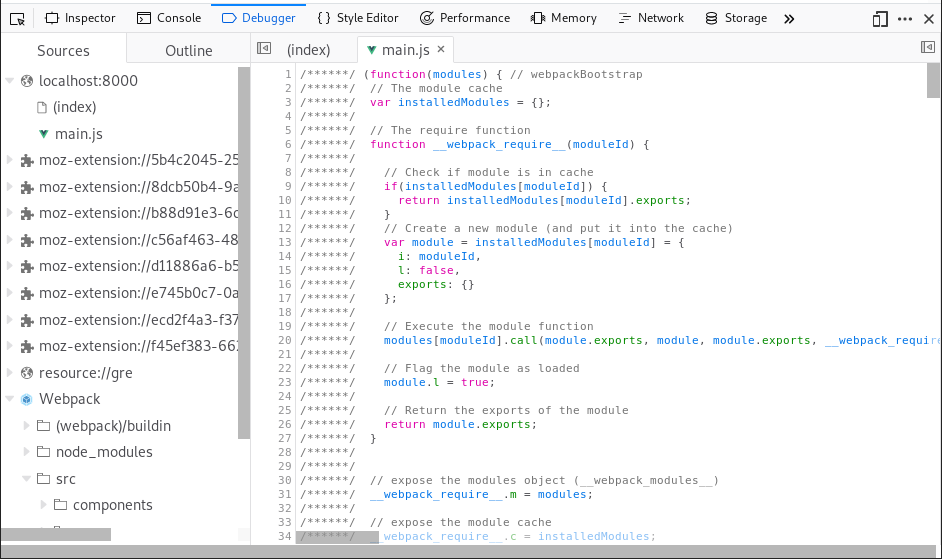
Looking at the application source in Firefox I can confirm that source maps are not functioning correctly:

Source Maps Not Working In Firefox Source View

The same behavior occurs in Chrome.

What could be causing source maps to not work correctly?

Note: The error shown in the screenshots is not the focus, I was able to figure it out. The main focus of the question is that source maps are not working correctly. Making it harder to debug issues when they do appear.

Lush answered 29/11, 2018 at 21:44 Comment(2)
Have you tried developers.google.com/web/tools/chrome-devtools/javascript/imgs/…Vipul
@StarkButtowski not my question but I did follow it. Yes, JS sourcemaps are enabled. I do get some explanation, but it's buried, and really not that explanatory.Peddler
R
6

If you're debugging in Chrome and sourcemaps are not working you have a few alternative options. This may not be as helpful as getting sourcemaps working, but your question has gone unanswered for a year and a half, so perhaps this will be useful.

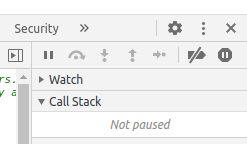
Sources Options

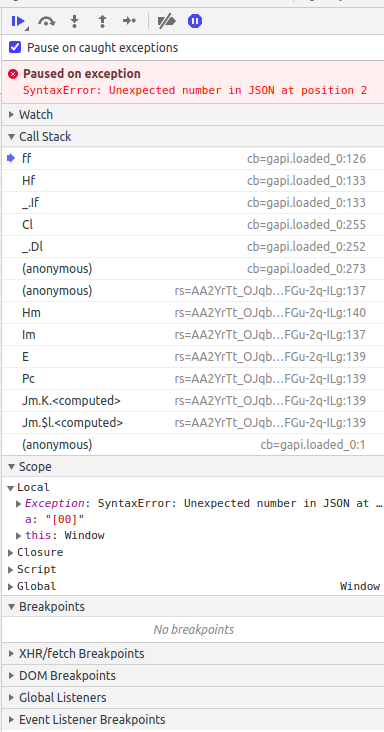
One of my favorites is to use the "Pause on Exceptions" toggle in the Sources tab. In the picture above it's the octogon with a pause icon. Click on that and refresh your page. When the error occurs your application will pause with the error in a full stack trace, like so:

Stack Trace Example

That Call Stack is clickable. You can move backward through calling functions until you see something identifiable from your own source. If source maps are not loading properly I'd recommend looking for string literals. Those won't be minified in the output and can point you back to where the error is being triggered.


Also, you may want to consider using a Vue plugin like Vue.js DevTools. I find this sort of data-centric view of the application quite helpful. You can watch state and mutations and even replay or modify actions happening in your app to pinpoint errors.

Rajab answered 25/7, 2020 at 19:36 Comment(1)
Thank you very much. These are great techniques for tracking down errors without source maps.Lush

© 2022 - 2024 — McMap. All rights reserved.