Display the maximum surface in matplotlib?
Asked Answered
C

4

23

I'm plotting multiple surfaces on the same figure using matplotlib, and I'd like to see only the topmost surface, as matlab shows.

Matlab 3D view: Matlab 3D view

Matlab top view: Matlab top view

Matplotlib 3D view: Matplotlib 3D view

Matplotlib top view: Matplotlib top view

How can I get Matplotlib to show a result similar to Matlab, in which whatever topmost class is shown at the top, as opposed to one single class taking precedence over the other?

Camion answered 15/2, 2015 at 22:7 Comment(8)
Use Matlab :P. No, really, Matplotlib is amazing, but it has some small things as this one that get into my nerves.Universalize
Using matlab isn't exactly an option for me...Camion
I guessed. Unfortunatedly matplotlib does this kind of visual things sometimes, and they are not nice. Hopefully someone knows how to fix it. Else I reccomend you manually crop the data so it does not exist.Universalize
I've tried switching through different backends, and that doesn't seem to work at all eitherCamion
Agreed, while matplotlib's 3D plotting can be quick and convenient, it's not actually that sophisticated. I know others have had success with mayavi, though I myself have not used it.Sharonsharona
Matplotlib doesn't actually do 3D plotting. This is a good example of what I mean by that. It doesn't have a 3D rendering engine, and approximates it through z-order of individual elements instead. For multiple surfaces or complex single surfaces, you'll have issues like this. For cases where you need occlusion to work properly, consider mayavi instead, as Ajean suggested.Bedfordshire
Do both views have to be on the same plot? You could do a 3d plot to show the surfaces and a 2d plot to do the top view.Roderica
@Roderica That's likely the workaround I'll be going with.Camion
U
12

I was goign to think about some dirty hacks like mgab mentions in their answer, but then decided just to go a considerably simpler route:

You can get a similar effect purely by using transparency, you just have to make sure the transparency is low enough, otherwise you still get obvious overlapping things happening:

from mpl_toolkits.mplot3d import Axes3D
from matplotlib import cm
from matplotlib.ticker import LinearLocator, FormatStrFormatter
import matplotlib.pyplot as plt
import numpy as np
from scipy.special import erf

fig = plt.figure()
ax = fig.gca(projection='3d')

X = np.arange(0, 6, 0.25)
Y = np.arange(0, 6, 0.25)
X, Y = np.meshgrid(X, Y)

Z1 = np.zeros_like(X)
Z2 = np.ones_like(X)

for i in range(len(X)):
  for j in range(len(X[0])):
    Z1[i,j] = 0.5*(erf((X[i,j]+Y[i,j]-4.5)*0.5)+1)
    Z2[i,j] = 0.5*(erf((-X[i,j]-Y[i,j]+4.5)*0.5)+1)


alpha = 0.25

surf1 = ax.plot_surface(X, Y, Z1, cstride=2, rstride=1, cmap=cm.Oranges, linewidth=0, antialiased=False, alpha=alpha)

surf2 = ax.plot_surface(X, Y, Z2, cstride=2, rstride=1, cmap=cm.Blues, linewidth=0, antialiased=False, alpha=alpha)

ax.zaxis.set_major_locator(LinearLocator(10))
ax.zaxis.set_major_formatter(FormatStrFormatter('%.02f'))

fig.colorbar(surf1, shrink=0.5, aspect=5)
fig.colorbar(surf2, shrink=0.5, aspect=5)

plt.show()

enter image description here

enter image description here

Adding an intersection line would be a nice addition, i don't have a simple way to add that in at the moment though.

EDIT: Stealing heavily from mgab's answer, using his "bridge" solution, but then also using colour maps for the surfaces, and setting the bridge faces to be transparent by using RGBA tuples, you can get almost exactly what you want:

from mpl_toolkits.mplot3d import Axes3D
import matplotlib.pyplot as plt
import numpy as np
from scipy.special import erf

fig = plt.figure()
ax = fig.gca(projection='3d')

X = np.arange(0, 6, 0.25)
Y = np.arange(0, 6, 0.25)
X, Y = np.meshgrid(X, Y)

Z1 = np.empty_like(X)
Z2 = np.empty_like(X)
C1 = np.empty_like(X, dtype=object)
C2 = np.empty_like(X, dtype=object)

for i in range(len(X)):
  for j in range(len(X[0])):
    z1 = 0.5*(erf((X[i,j]+Y[i,j]-4.5)*0.5)+1)
    z2 = 0.5*(erf((-X[i,j]-Y[i,j]+4.5)*0.5)+1)
    Z1[i,j] = z1
    Z2[i,j] = z2

    # If you want to grab a colour from a matplotlib cmap function, 
    # you need to give it a number between 0 and 1. z1 and z2 are 
    # already in this range, so it just works.
    C1[i,j] = plt.get_cmap("Oranges")(z1)
    C2[i,j] = plt.get_cmap("Blues")(z2)


# Create a transparent bridge region
X_bridge = np.vstack([X[-1,:],X[-1,:]])
Y_bridge = np.vstack([Y[-1,:],Y[-1,:]])
Z_bridge = np.vstack([Z1[-1,:],Z2[-1,:]])
color_bridge = np.empty_like(Z_bridge, dtype=object)

color_bridge.fill((1,1,1,0)) # RGBA colour, onlt the last component matters.

# Join the two surfaces flipping one of them (using also the bridge)
X_full = np.vstack([X, X_bridge, np.flipud(X)])
Y_full = np.vstack([Y, Y_bridge, np.flipud(Y)])
Z_full = np.vstack([Z1, Z_bridge, np.flipud(Z2)])
color_full = np.vstack([C1, color_bridge, np.flipud(C2)])

surf_full = ax.plot_surface(X_full, Y_full, Z_full, rstride=1, cstride=1,
                            facecolors=color_full, linewidth=0,
                            antialiased=False)


plt.show()

enter image description here

enter image description here

Ulmaceous answered 19/2, 2015 at 13:50 Comment(2)
Quite a big theft indeed... :-SCory
Haha, don't worry about the theft – I think you guys both get the bounty. I haven't implemented it in my code yet, but this looks great! (I can only award a second bounty in 24h, fyi)Camion
C
8

Answer

As pointed in the comments to the question, matplotlib does not do really 3d plotting, and the approximation it does can give you limited results. The issue you are encountering it is actually acknowledged in the mplot3d module's FAQ.

They also direct you to MayaVi if you want to do serious 3D plotting. If you don't really need 3D plotting and only care about the top view then I would do a 2D plot directly as suggested by Bensciens in the comments...

Dirty Workarounds

Of course, if you're willing to pay with programmer souls, there is almost always a solution involving some dark magic... :P

Option 1

If you really only need the two views you put as example and the surfaces are something similar to those ones, you can plot first the part that lays behind of surface A, then all surface B and then the part that lays on top of surface A... Let me explain:

As pointed out here and here plot_surfaces() does not care about masks, but you can use NaN values to get a similar effect. You can use this to plot first only the values that are below the other surface and then only the ones that are above...

from mpl_toolkits.mplot4d import Axes3D
import matplotlib.pyplot as plt
import numpy as np

fig = plt.figure()
ax = fig.gca(projection='3d')
X = np.arange(-5, 5, 0.25)
Y = np.arange(-5, 5, 0.25)
X, Y = np.meshgrid(X, Y)

R = (X+Y)
Z1 = R/R.max()
Z2 = -R/R.max()

surfA_bottom = ax.plot_surface(X, Y, np.where(Z1<=Z2,Z1, np.nan),
                               rstride=1, cstride=1, color='r', linewidth=0)

surfB = ax.plot_surface(X, Y, Z2,
                        rstride=1, cstride=1, color='b', linewidth=0)

surfA_top = ax.plot_surface(X, Y, np.where(Z1>=Z2,Z1, np.nan),
                            rstride=1, cstride=1, color='r', linewidth=0)

ax.set_zlim3d(-1, 1)
ax.set_ylim(-5,5)
ax.set_xlim(-5,5)

plt.show()

3d plot with masked array 1

3d plot with masked array 2

Option 2

(It has some explanation, skip to the last piece of code if you want just the solution!)

This solution is slightly more complicated but more robust also to more complex surfaces... The thing is that 3d plots in matplotlib don't handle well the depth for different objects... right? but it does for a single object... What about plotting both surfaces as a single surface, then??

To do this you need to to merge all the points into a single surface (you can have multiple Z values for repeated X-Y combinations). To differentiate the two parts of our new surface (our former two surfaces) we can use the facecolors kwarg. (I added some alpha value to see more clearly what's going on)

from mpl_toolkits.mplot4d import Axes3D
import matplotlib.pyplot as plt
import numpy as np

fig = plt.figure()
ax = fig.gca(projection='3d')
X = np.arange(-5, 5, 0.25)
Y = np.arange(-5, 5, 0.25)
X, Y = np.meshgrid(X, Y)

Z1 = np.sin(np.sqrt(X**2+Y**2))
Z2 = np.ones_like(Z1)*0.6

C1 = np.empty_like(X, dtype=str)
C1.fill('b')
C2 = C1.copy()
C2.fill('r')

X3 = np.vstack([X,X])
Y3 = np.vstack([Y,Y])
Z3 = np.vstack([Z1,Z2])
C3 = np.vstack([C1,C2])


surf3 = ax.plot_surface(X3, Y3, Z3, rstride=1, cstride=1,
                       facecolors=C3, linewidth=0,
                       antialiased=False, alpha=0.5)

ax.set_zlim3d(-1, 2)
plt.show()

3d plot merging to one array 1

As you can see the results are pretty good but there is some weird effect since one extreme of one surface is connected to the other extreme of the other surface. How to get rid of it? Transparencies are not an option since, as far as I know, plot_surface() allows only an alpha value that affects the whole surface. I also tried to mask the transitions using a row of NaN values in X,Y and Z in a similar way as in workaround 1, but then the render gets broken. You may try, maybe it depends on my installation.

EDIT: I found a less elegant and more problematic solution, but as @will points out you can set transparency only in the bridge region by specifying the colors with rgba synthax. I'll leave my version for the review history, since the answer is already long enough... :P

(you could get softer edges increasing the number of points)

from mpl_toolkits.mplot3d import Axes3D
import matplotlib.pyplot as plt
import numpy as np

fig = plt.figure()
ax = fig.gca(projection='3d')
X = np.arange(-5, 5, 0.25)
Y = np.arange(-5, 5, 0.25)
X, Y = np.meshgrid(X, Y)

# Complex shape from examples in matplotlib gallery
Z1 = np.sin(np.sqrt(X**2+Y**2))
Z2 = np.ones_like(Z1)*0.6

# Define the color for each one of our surfaces
# (it doesn't need to be a gradient)
color1 = np.empty_like(X, dtype=str)
color1.fill('b')
color2 = np.empty_like(X, dtype=str)
color2.fill('r')

# Create a white bridge region
X_bridge = np.vstack([X[-1,:],X[0,:]])
Y_bridge = np.vstack([Y[-1,:],Y[0,:]])
Z_bridge = np.vstack([Z1[-1,:],Z2[0,:]])
color_bridge = np.empty_like(Z_bridge, dtype=object)
color_bridge.fill((1,1,1,0))

# Join the two surfaces (using also the bridge)
X_full = np.vstack([X, X_bridge, X])
Y_full = np.vstack([Y, Y_bridge, Y])
Z_full = np.vstack([Z1, Z_bridge, Z2])
color_full = np.vstack([color1, color_bridge, color2])

surf_full = ax.plot_surface(X_full, Y_full, Z_full, rstride=1, cstride=1,
                                    facecolors=color_full, linewidth=0,
                                                                antialiased=False)

ax.set_zlim3d(-1, 2)
ax.set_ylim(-5,5)
ax.set_xlim(-5,5)

plt.show()

enter image description here

enter image description here

Cory answered 19/2, 2015 at 13:38 Comment(11)
You so nearly had it. So nearly. Matplotlib allows rgba colours, so you can do color_bridge = np.empty_like(Z_bridge, dtype=object) and then color_bridge.fill((1,1,1,0)) to fill purely those faces with transparent colours. Done.Ulmaceous
Sorry. I stole from your answer, adding in a transparent bridge, and face colours using a colour maps. I think it should be fairly easy to turn this into a standard function though, which could possibly be added into MPL.Ulmaceous
@Ulmaceous Argh, of course! Good point! edited in the answer... (quite a big theft, though, no? :-S )Cory
You had me at Dark Magic.Camion
I'm sorry about the theft. Mostly. Did you come up with this solution yourself? Or find it somewhere a while back?Ulmaceous
My understanding is that the flipup is only needed if the surfaces of the bridge are not transparent - can you see any reason that it would not be possible to chain an infinite number of surfaces together?Ulmaceous
I did found it myself. I got the idea from the fact that in the matplotlib gallery there are 3D plots only with single surfaces but that some of them have rather complex shapes and render completely OK. Then I mostly described my line of exploration...Cory
Ah, it should really be explored more, if matplotlib could be coerced into treating it like this always (i.e. rewrite the 3D artist, or whatever part it is that draws these) to do this itself), then the problem would go away.Ulmaceous
Is there someone I should try to get the attention of who works on Matplotlib? I haven't contributed code to a major project yet, so I get the feeling this could be left in better hands than mine...Camion
I added this to the mpl stack overflow documentation stuff, it's pending approval at the moment, here.Ulmaceous
I do not think it is fair to call this a "dirty hack" as this is exactly what matlab is doing inside, it is just that Matplotlib does not have the internal z-buffer to support it.Eustis
A
1

Color Mapping the Intersecting Surfaces

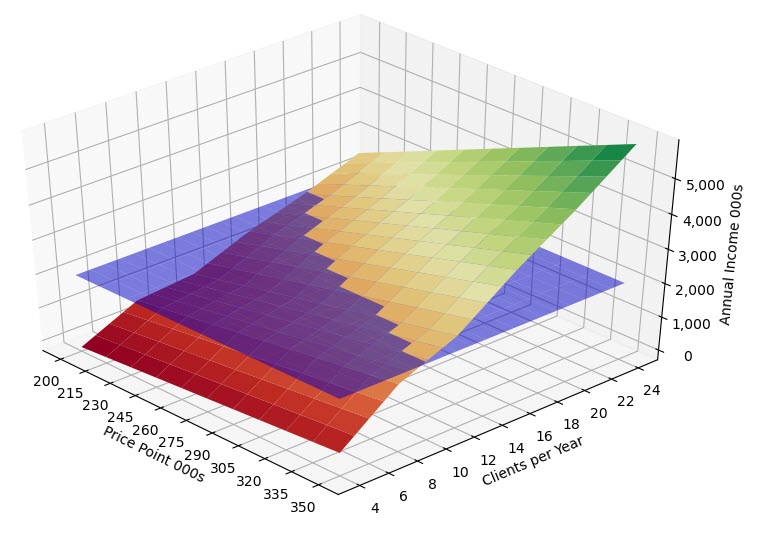
First of all, thanks to @will and @mgab for solving the problem. I used your technique to spice up a business plan I am working on (see chart). I am just ringing in on the "alpha" question.

enter image description here

Yes, you can have different opacity on the surfaces, by using that fourth attribute in the RGBA syntax. You can also use a sequential color map, by passing it a min-max scaled Z value.

for i in range(len(X)):
    for j in range(len(X[0])):
        C1[i,j] = plt.get_cmap('RdYlGn')((Z1[i,j]-Z_min)/Z_range) 
        C2[i,j] = (0,0,1,0.5)

P.S. That income surface is not a plane. It recalculates the P&L for each combination of the two parameters.

Apostles answered 15/8, 2020 at 15:45 Comment(0)
C
0

As I understand the ax.plplot_surface method can plot good graph only for one surface, so if you need plot several surfaces you need to combine them in one common np.array.

I prepared some code, that I hope will help for that:

    # normalize values to range [0;1] for getting color from cmap
    def norm_v(v) :
        v_min = v.min()
        v_max = v.max()
        if v_min-v_max == 0 :
            v.fill(0.5)
            return v
        return (v-v_min)/(v_max-v_min)

    # combine several surfaces in one for plotting at once
    def combine_in_one_graph(X,Y,*Z) :
        cmaps_name = ['viridis', 'plasma', 'inferno', 'magma', 'cividis'] 

        # transparent connection between grahps
        transparen_link = np.empty_like(X[0], dtype=object)
        transparen_link.fill((1,1,0,0))

        # include first graph
        combined_X = X
        combined_Y = Y
        combined_Z = Z[0]

        # prepare collor matrix for first graph (Z[0])
        combined_Color = np.empty_like(X, dtype=object)
        normed_Z = norm_v(Z[0])
        for i in range(len(combined_Color)) :
            for j in range(len(X[0])) :
                combined_Color[i,j] = plt.get_cmap(cmaps_name[0])(normed_Z[i,j])

        # first row of collor matrix is not used in ploting, and will displace transparent links
        # so we need to remove first row
        combined_Color = combined_Color[1:]

        # second aray combined with first in backward direction, so connection would on one side of graphs, not intersect them 
        direction = -1 
        cmap_index = 1
        for next_Z in Z[1:] :

            combined_X = np.vstack([combined_X, X[::direction][0], X[::direction]])
            combined_Y = np.vstack([combined_Y, Y[::direction][0], Y[::direction]])
            combined_Z = np.vstack([combined_Z, next_Z[::direction][0], next_Z[::direction]])

            # prepare collors for next Z_ 
            next_C = np.empty_like(X, dtype=object)
            normed_Z = norm_v(next_Z)

            for i in range(len(X)) :
                for j in range(len(X[0])) :
                    next_C[i,j] = plt.get_cmap(cmaps_name[cmap_index])(normed_Z[i,j])

            combined_Color = np.vstack([combined_Color ,transparen_link ,next_C[::direction]])

            direction *= -1
            cmap_index += 1

        fig = plt.figure(figsize=(15,15))
        ax = fig.gca(projection='3d') # get current axis
        surf = ax.plot_surface(combined_X, combined_Y, combined_Z, facecolors=combined_Color, rstride=1, cstride=1,
                                 linewidth=0,
                                antialiased=False )

        # rotate graph on angle in degrees
        ax.view_init(azim=-60)

        ax.set_xlabel('X')
        ax.set_ylabel('Y')
        ax.set_zlabel('Z')
        plt.show()


    X = np.arange(0.2, 1.06, 0.01)
    Y = np.arange(0.2, 1.06, 0.01)
    X, Y = np.meshgrid(X, Y)


    Z1 = 2*np.sin(np.sqrt(20*X**2+20*Y**2))
    Z2 = 2*np.cos(np.sqrt(20*X**2+20*Y**2))
    Z3 = X*0+1
    Z4 = Y*0+1.5

    combine_in_one_graph(X,Y,Z1,Z2,Z3,Z4)

some tests

Coss answered 5/11, 2020 at 21:58 Comment(0)

© 2022 - 2024 — McMap. All rights reserved.