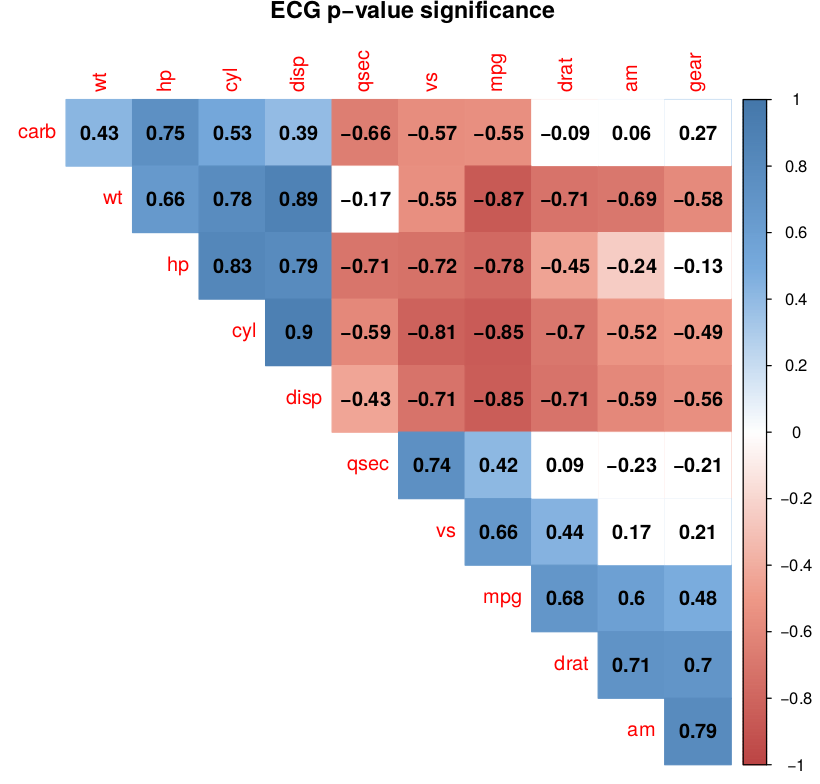
Code and its output where title is wrongly positioned outside the window page:
library('corrplot')

#options(error=recover) # https://mcmap.net/q/257740/-subscript-out-of-bounds-general-definition-and-solution
#debugger()
# load("last.dump.rda"); debugger(last.dump) # run if fail
options(error=function() dump.frames(to.file=TRUE))

# http://www.sthda.com/english/wiki/visualize-correlation-matrix-using-correlogram
cor.mtest <- function(mat, ...) {
    mat <- as.matrix(mat)
    n <- ncol(mat)
    p.mat<- matrix(NA, n, n)
    diag(p.mat) <- 0
    for (i in 1:(n - 1)) {
        for (j in (i + 1):n) {
            tmp <- cor.test(mat[, i], mat[, j], ...)
            p.mat[i, j] <- p.mat[j, i] <- tmp$p.value
        }
    }
  colnames(p.mat) <- rownames(p.mat) <- colnames(mat)
  p.mat
}

M <- cor(mtcars)

p.mat <- cor.mtest(M)

title <- "ECG p-value significance"
col <- colorRampPalette(c("#BB4444", "#EE9988", "#FFFFFF", "#77AADD", "#4477AA"))
corrplot(M, method="color", col=col(200),
     diag=FALSE, # tl.pos="d",
         type="upper", order="hclust",
     title=title,
         addCoef.col = "black", # Add coefficient of correlation
         # Combine with significance
         p.mat = p.mat, sig.level = 0.05, insig = "blank"
         # hide correlation coefficient on the principal diagonal
         )
Fig. 1 Output
R: 3.3.1
OS: Debian 8.5
Related ticket: #72


mar=c(0,0,1,0)? – Ambros