seaborn boxplot: Change color and shape of mean
Asked Answered
E

1

23

Simple question that I cannot seem to find the answer to.

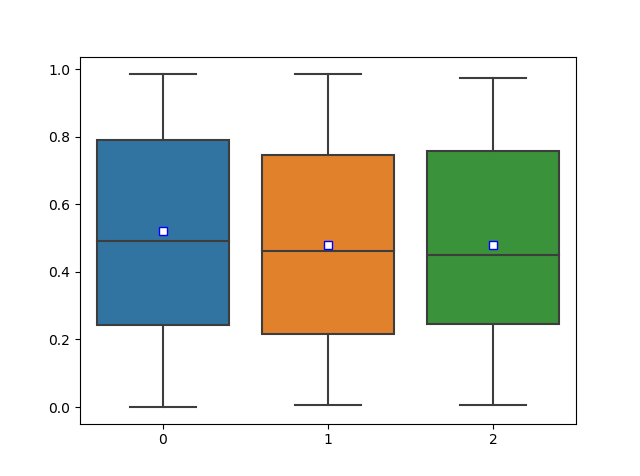
How do I change the color and shape of the mean indicator in a Seaborn Boxplot?

It defaults to a Green Triangle and it generally difficult to see.

I've tried to find the answer in both the seaborn documentation, as well as the matplotlib documentation. There is also a related question on stackoverflow where someone asked how to change around colors related to the seaborn boxplots and was able to change everything except for the mean indicator.

import numpy as np
import matplotlib.pyplot as plt
import seaborn as sns

data = [[np.random.rand(100)] for i in range(3)]

sns.boxplot(data=data, showmeans=True)

plt.show()

Seaborn Boxplot

Enteron answered 10/1, 2019 at 16:27 Comment(0)
P
43

The keyword argument you are looking for is meanprops. It is in the matplotlib boxplot documentation under "other parameters":

import seaborn as sns

data = [[np.random.rand(100)] for i in range(3)]

sns.boxplot(data=data, showmeans=True,
            meanprops={"marker":"s","markerfacecolor":"white", "markeredgecolor":"blue"})

plt.show()

enter image description here

Pontiac answered 10/1, 2019 at 16:44 Comment(2)
You're the best! Thanks!Enteron
so seaborn boxplot is nothing more that a plt.boxplotMapes

© 2022 - 2024 — McMap. All rights reserved.