Set a breakpoint in XHR in Chrome
Asked Answered
P

7

27

I have a page that sends an XHR request when a form is submitted and I would like to get Chrome to break when it receives a response. It seems like the best way to accomplish this would be if Chrome has a javascript function that I can call that breaks execution but I've been unable to find anything like that so far. Is there another solution?

Edit:

I don't actually have a callback defined for the request so I can't set a breakpoint that way. The request is being sent with this line of jquery code:

$.post(this.action, $(this).serialize(), null, "script");

where this is a form element. The null argument is where you would usually define a callback but with the "script" argument, raw javascript is returned by the server and then directly executed, so it seems the only way to break and step through the code is with the debugger; statement. This works, but when stepping through the code you can't actually see which line you are on so its a little awkward. I suspect that this is a limitation of Chrome's debugging tools.

Plum answered 14/7, 2010 at 19:24 Comment(1)
I don't get it. If you null the callback, wouldn't all response be ignored? Where did you want the debugger to break at?Lilybelle
S
19

drop down the chrome console (ctrl+shift+j) and type any of these:

Just rewrite the jquery ajax:

var prevajax = jQuery.ajax;
jQuery.ajax = function () { debugger; return prevajax.apply(jQuery, arguments); };

or if you are not using jQuery, rewrite the xhr class:

var prevxhr = XMLHttpRequest;
XMLHttpRequest = function (){debugger; prevxhr.apply(this, arguments);};

After it breaks, just press shift+f11 until you find the method which initiates the ajax request.

Striate answered 26/4, 2014 at 19:42 Comment(1)
xhr = new XMLHttpRequest Uncaught TypeError: Failed to construct 'XMLHttpRequest': Please use the 'new' operator, this DOM object constructor cannot be called as a function. at new XMLHttpRequest (<anonymous>:2:48) at <anonymous>:1:7Insufflate
F
15

You can just set a breakpoint in the success callback and step through the debugger. To set a breakpoint:

  1. Open "Developer Tools", and click the "Scripts" tab on the top.
  2. Select the script that contains the success callback for your AJAX request.
  3. Click the line number on the left hand side where you want the breakpoint. A blue arrow will show up indicating the breakpoint has been set.
  4. Then make the AJAX request as you would, and the debugger will automatically stop at the breakpoint you set.

Alternatively, you can use the debugger statement to automatically invoke the debugger. So with this your success callback may look like:

success: function(data, textStatus, request) {
    debugger; // pause execution and opens debugger at this point
    ...
}

Also checkout this nice article for debugging JavaScript.

However, the first approach is better as it doesn't require you to modify your code.

Feed answered 14/7, 2010 at 20:36 Comment(1)
Thank you for the well thought out answer. The debugger statement definitely got me a lot closer. I edited my question to clarify that I don't actually have a callback function defined so setting a breakpoint with debugger seems to be the only option.Plum
P
15

You can also go to scripts tab in developer tool, and on the right side you click on XHR Breakpoints and add new breakpoint with url filtering.

If you use jQuery, when breakpoint occurs you can use CallStack to find your function that called jQuery.ajax.

Pattison answered 27/3, 2013 at 16:17 Comment(0)
A
3

For me the solution was to use Initiator tab in the Network panel, it showed me the script that sent the request

Anglicanism answered 24/7, 2021 at 9:53 Comment(0)
S
1

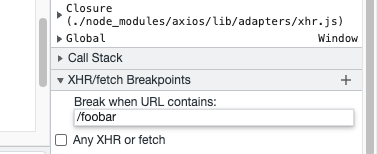
Since this question was asked (in 2010) chrome has added support for breakpoints on xhr (ajax, fetch). You can specify a substring for the url to set a conditional xhr breakpoint.

chrome devtools xhr breakpoint

https://developer.chrome.com/docs/devtools/javascript/breakpoints/#xhr

Samphire answered 26/1, 2023 at 20:18 Comment(0)
Z
0

ES6+

XMLHttpRequest = (Parent =>
    class XMLHttpRequest extends Parent {
        constructor() {
            const onload = () => {
                this.removeEventListener('load', onload);
                debugger;
            };
            super(...arguments);
            this.addEventListener('load', onload);
        }
    }
)(XMLHttpRequest);

ES5

XMLHttpRequest = (function (Parent) {
    XMLHttpRequest.prototype = Parent;

    return XMLHttpRequest;

    function XMLHttpRequest() {
        var self = this;
        Parent.apply(this, arguments);
        this.addEventListener('load', function () {
            self.removeEventListener('load', onload);
            debugger;
        });
    }
})(XMLHttpRequest);

This should let you inspect the request/response in the Network developer tool.

Note 01

ES5 syntax IS NOT to be understood as ES5+ mainly because function extends class ... isn't something that works at runtime. The class part will fail with Uncaught TypeError: Failed to construct 'XMLHttpRequest': Please use the 'new' operator. At that point, you may consider changing :

Parent.apply(this, arguments);

into

super(...arguments);

Note 02

Every solution here supposes that the library that issue the XHR request did not cache the XMLHttpRequest constructor [yet].

Note 03

The above code does not work with ES5 especially b/c of supper vs. .prototype inheritance syntax.

In order to circumvent thes issues, one may tap into the prototype. In the following code, I choosed to tap into the the xhr.send method.

ES5+

XMLHttpRequest.prototype.send = (function (send) {
    return function () {
        this.addEventListener('load', function onload() {
            this.removeEventListener('load', onload);
            debugger;
        });

        return send.apply(this, arguments);
    };
})(XMLHttpRequest.prototype.send);

That said, the latter code didn't work for the issue that had me dig into this... Mainly because the internal Angular code registered an event listener (that fully redirects the browser) before even calling the xhr.send method. Not great, eh !?

That's it!

Zug answered 16/1, 2020 at 10:52 Comment(0)
Q
0

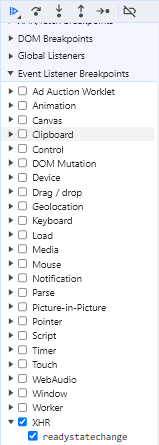
Currently in 2023, Breakpoints can be placed under the XHR option under the Event Listener Breakpoints in the Sources panel. (Note that another xhr breakpoint item, XHR/fetch Breakpoints, is only triggered when sending, not when receiving a response.)

enter image description here

Quid answered 7/12, 2023 at 6:5 Comment(0)

© 2022 - 2024 — McMap. All rights reserved.