How to use `lmplot` to plot linear regression without intercept?
Asked Answered
W

3

24

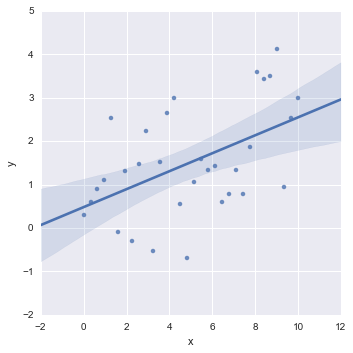
The lmplot in seaborn fit regression models with intercept. However, sometimes I want to fit regression models without intercept, i.e. regression through the origin.

For example:

In [1]: import numpy as np
   ...: import pandas as pd
   ...: import seaborn as sns
   ...: import matplotlib.pyplot as plt
   ...: import statsmodels.formula.api as sfa
   ...: 

In [2]: %matplotlib inline
In [3]: np.random.seed(2016)
In [4]: x = np.linspace(0, 10, 32)
In [5]: y = 0.3 * x + np.random.randn(len(x))
In [6]: df = pd.DataFrame({'x': x, 'y': y})
In [7]: r = sfa.ols('y ~ x + 0', data=df).fit()
In [8]: sns.lmplot(x='x', y='y', data=df, fit_reg=True)
Out[8]: <seaborn.axisgrid.FacetGrid at 0xac88a20>

enter image description here

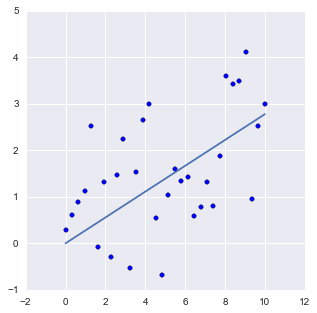
The figure what I wanted:

In [9]: fig, ax = plt.subplots(figsize=(5, 5))
   ...: ax.scatter(x=x, y=y)
   ...: ax.plot(x, r.fittedvalues)
   ...: 
Out[9]: [<matplotlib.lines.Line2D at 0x5675a20>]

enter image description here

Warram answered 11/1, 2016 at 15:57 Comment(4)
Not an option, sorry.Navarre
@Navarre Is there any plan to support it in the future?Warram
@Navarre you probably want to post that as an answer with some documentation links.Uncouth
@mnagel Isn't that sufficiently answered by e.g. this question?Inconclusive
I
1

The seaborn API does not directly allow to change the linear regression model.

The call chain is:

  • at some point _RegressionPlotter.plot() is called to produce the plot
  • which calls _RegressionPlotter.lineplot() to perform the fit plot
  • which itselfs calls fit_regression which is located in the regression module
  • which in turn calls many seaborn regression methods such as self.fit_fast(grid) in your case.

To use a different regression model, you may:

  • monkey patch the _RegressionPlotter class and change the lineplot() behavior
  • monkey patch the fit_regression() or fit_fast() method in regression module

To do such a seaborn monkey patch, you can refer to an answer I made a while ago that does the same type of hack. This bad, and Santa may not be happy. This means you dynamically modify seaborn for your intended purpose.

Of course, you would need to implement your own regression model to have a law in the for y = a * x instead of y = (a * x) + b. importanceofbeingernest alreadypointed out in a comment this SO question for that matter.


An elegant way around would be to build your own plot, but you already answered that part in your own question.

Quoting your own question (I did not check the code provided):

import numpy as np
import pandas as pd
import matplotlib.pyplot as plt
import statsmodels.formula.api as sfa

np.random.seed(2016)
x = np.linspace(0, 10, 32)
y = 0.3 * x + np.random.randn(len(x))
df = pd.DataFrame({'x': x, 'y': y})
r = sfa.ols('y ~ x + 0', data=df).fit()
fig, ax = plt.subplots(figsize=(5, 5))
ax.scatter(x=x, y=y)
ax.plot(x, r.fittedvalues)
Imaret answered 4/10, 2019 at 21:1 Comment(0)
S
-1

If its just for displaying purposes you can trick around and change the y-ticks by adjusting them by the mean of your data.

You could do sth like:

sns.lmplot(x='x', y='y', data=df, fit_reg=True)
y_ticks = [int(round(ytick - np.mean(y), 0)) for ytick in plt.gca().get_yticks()]
plt.gca().set_yticklabels(y_ticks)

Be aware, that this will not change the line itself nor any internals, just the ready-done vizualization.

Shavonneshaw answered 27/8, 2019 at 21:5 Comment(2)
I don't think this is equivalent to fitting a no-intercept model. The slope will also differ depending on whether or not an intercept is fitted.Inflate
@Inflate that is right. It generally will not change the model but just shift the axis optically. If the model should reflect it, I guess the only valid option is to (i) fit a common linear regression without intercept (for example using sklearn) and (ii) draw the line with the learned slope as a separate actor onto the axis.Shavonneshaw
N
-5

Does this suit your purpose?

sns.lmplot(x='x', y='y', data=df, fit_reg=False)
Nopar answered 22/5, 2017 at 21:28 Comment(1)
We still want the linear regression line, but it to pass through (0,0)Defrock

© 2022 - 2024 — McMap. All rights reserved.