How to smooth by interpolation when using pcolormesh?
Asked Answered
F

1

24

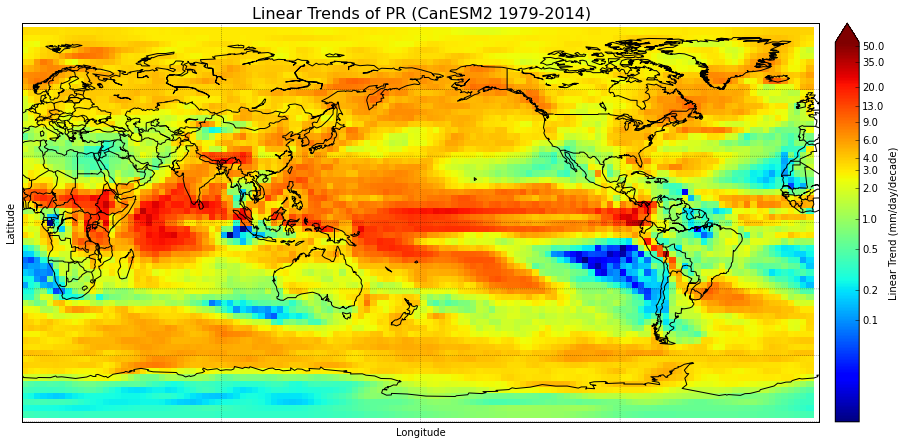
I have a basemap of the world, and it's filled with data (lintrends_mean) using pcolormesh. Because the data has relatively large grid boxes, I'd like to smooth the plot. However, I can't figure out how to do this. Setting shading='gouraud' in the plotting function blurs the edges of the grid boxes, but I'd like something nicer-looking than that since the data still appears blotchy.

There was a similar question asked here with an answer given, but I don't understand the answer, particularly where the "newdepth" comes from. I can't comment on it for clarification either since I'm short on reputation. interpolation with matplotlib pcolor

#Set cmap properties
bounds = np.array([0.1,0.2,0.5,1,2,3,4,6,9,13,20,35,50])
norm = colors.LogNorm(vmin=0.01,vmax=55) #creates logarithmic scale
#cmap.set_under('#000099') # I want to use this- edit in Paint
cmap.set_over('#660000')  # everything above range of colormap

fig = plt.figure(figsize=(15.,10.))                     #create figure & size
m = Basemap(projection='cyl',llcrnrlat=-90,urcrnrlat=90,llcrnrlon=0,urcrnrlon=360.,lon_0=180.,resolution='c') #create basemap & specify data area & res
m.drawcoastlines(linewidth=1)
m.drawcountries(linewidth=1)
m.drawparallels(np.arange(-90,90,30.),linewidth=0.3)
m.drawmeridians(np.arange(-180.,180.,90.),linewidth=0.3)            
meshlon,meshlat = np.meshgrid(lon,lat)                           #meshgrid turns lats & lons into 2D arrays
x,y = m(meshlon,meshlat)                                         #assign 2D arrays to new variables
trend = m.pcolormesh(x,y,lintrends_mean,cmap=plt.get_cmap('jet'),norm=norm) #plot the data & specify colormap & color range
cbar=m.colorbar(trend,size="3%", label='Linear Trend (mm/day/decade)',ticks=bounds,extend="max")
cbar.set_ticklabels(bounds)
plt.title('Linear Trends of PR (CanESM2 1979-2014)',fontsize=16)
plt.xlabel('Longitude',fontsize=10)
plt.ylabel('Latitude',fontsize=10)
plt.show()

enter image description here

Flaxen answered 14/6, 2016 at 22:7 Comment(3)
It looking blocky could be considered a feature, not a bug. It does not make your data look on a finer grid than it really is.Caban
I know the blockiness is not a bug. My research advisor just suggested I smooth the grid for presentation reasons, and I didn't like how just applying gouraud shading looked.Flaxen
I suggest interpolating before plotting than. It gives you more control.Caban
C
26

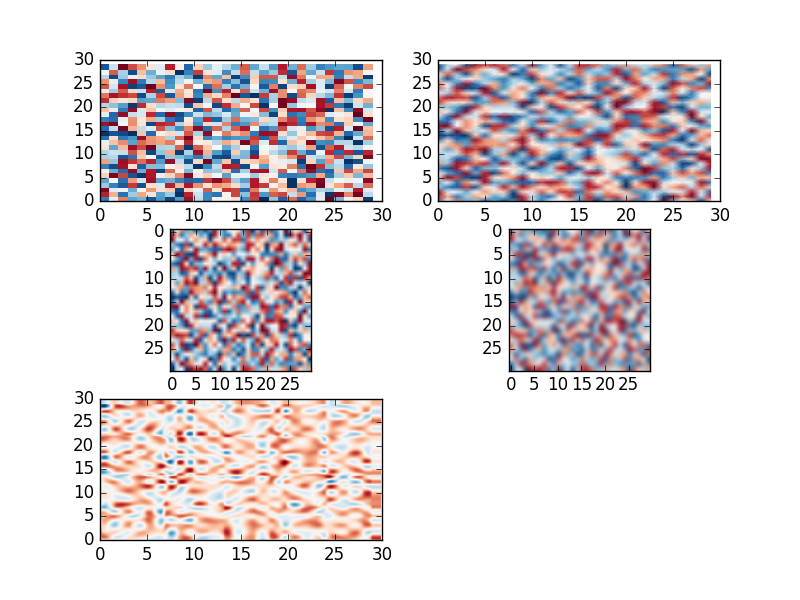
You have some variants:

  1. Use special shading for pcolormesh.
  2. Use imshow which allows to interpolated data.
  3. Interpolate data with scipy.interpolate and plot with pcolormesh.

Look at the example:

import matplotlib.pylab as plt
import numpy as np
from scipy.interpolate import interp2d

data = np.random.random((30,30))
X = np.arange(0, 30, 1)
Y = np.arange(0, 30, 1)
X, Y = np.meshgrid(X, Y)

# colormesh original
plt.subplot(3, 2, 1)
plt.pcolormesh(X, Y, data, cmap='RdBu')

# pcolormesh with special shading
plt.subplot(3, 2, 2)
plt.pcolormesh(X, Y, data, cmap='RdBu',shading='gouraud')

# imshow bilinear interp.
plt.subplot(3, 2, 3)
plt.imshow(data, cmap='RdBu', interpolation = 'bilinear')

# imshow bicubic interp.
plt.subplot(3, 2, 4)
plt.imshow(data, cmap='RdBu', interpolation = 'bicubic')

# scipy interp. cubic
f = interp2d(X, Y, data, kind='cubic')
xnew = np.arange(0, 30, .1)
ynew = np.arange(0, 30, .1)
data1 = f(xnew,ynew)
Xn, Yn = np.meshgrid(xnew, ynew)
plt.subplot(3, 2, 5)
plt.pcolormesh(Xn, Yn, data1, cmap='RdBu')

plt.show()

enter image description here

Cineaste answered 14/6, 2016 at 22:42 Comment(4)
I can't use the imshow method since that causes my data to not span the full basemap. In your last subplot, would your X & Y in f = interp2d(X, Y, data, kind='cubic') correspond to my meshlon & meshlat?Flaxen
Yep, but they have to be 2d arrays of the same sizeCineaste
This method isn't quite working out well for me. I'm having issues getting the interpolation schemes for work well with my data. For cubic interpolation, I get the error "RuntimeWarning: No more knots can be added because the number of B-spline. Coefficients already exceeds the number of data points m. Probable causes: either s or m too small." I'm not entirely sure what that means, but the result is a sort of checkboard of unfilled data near my highest values. Is this an effect of my data values, and would a different interpolation method work better?Flaxen
Also, I'm getting "Unsupported interpolation type" for some interpolations that should be allowed, like "nearest", "bilinear", & "bicubic", though "linear" works fine. I'm using Python 2.7. Do I need to update the package?Flaxen

© 2022 - 2024 — McMap. All rights reserved.