Fitting a quadratic curve in ggplot
Asked Answered
G

1

24

This is my sample data. I want to plot both y1 and y2 against x1 in a single plot. This is what I did:

library(ISLR)
library(ggplot2)

y1<-scale(Auto$horsepower,scale = T,center=T)
y2<-scale(Auto$weight,scale = T,center=T)
x1<-Auto$mpg
df<-data.frame(y1,y2,x1)

p<-ggplot(df,aes(x=x1)) + 
   geom_point(aes(y = y1), shape = 16) +
   geom_point(aes(y = y2), shape = 2) 

I want to insert a quadratic line for both y1 and y2 against x. I did this:

p + stat_smooth(method = "lm", formula = y ~ x + I(x^2), size = 1)

It throws up an error:

Warning message:
Computation failed in `stat_smooth()`:
variable lengths differ (found for 'x')  

Other than this, the stat_smooth command will only put one quadratic line while I need two quadratic lines for both y1 and y2.

How did I achieve this in R?

Thanks

Goulden answered 13/3, 2017 at 12:48 Comment(0)
S
44

You should add two stat_smooth() calls and add aes() to show which y to use.

ggplot(df,aes(x=x1)) + 
      geom_point(aes(y = y1), shape = 16) +
      geom_point(aes(y = y2), shape = 2) +
      stat_smooth(aes(y = y1),method = "lm", formula = y ~ x + I(x^2), size = 1) +
      stat_smooth(aes(y = y2),method = "lm", formula = y ~ x + I(x^2), size = 1, color = "red")

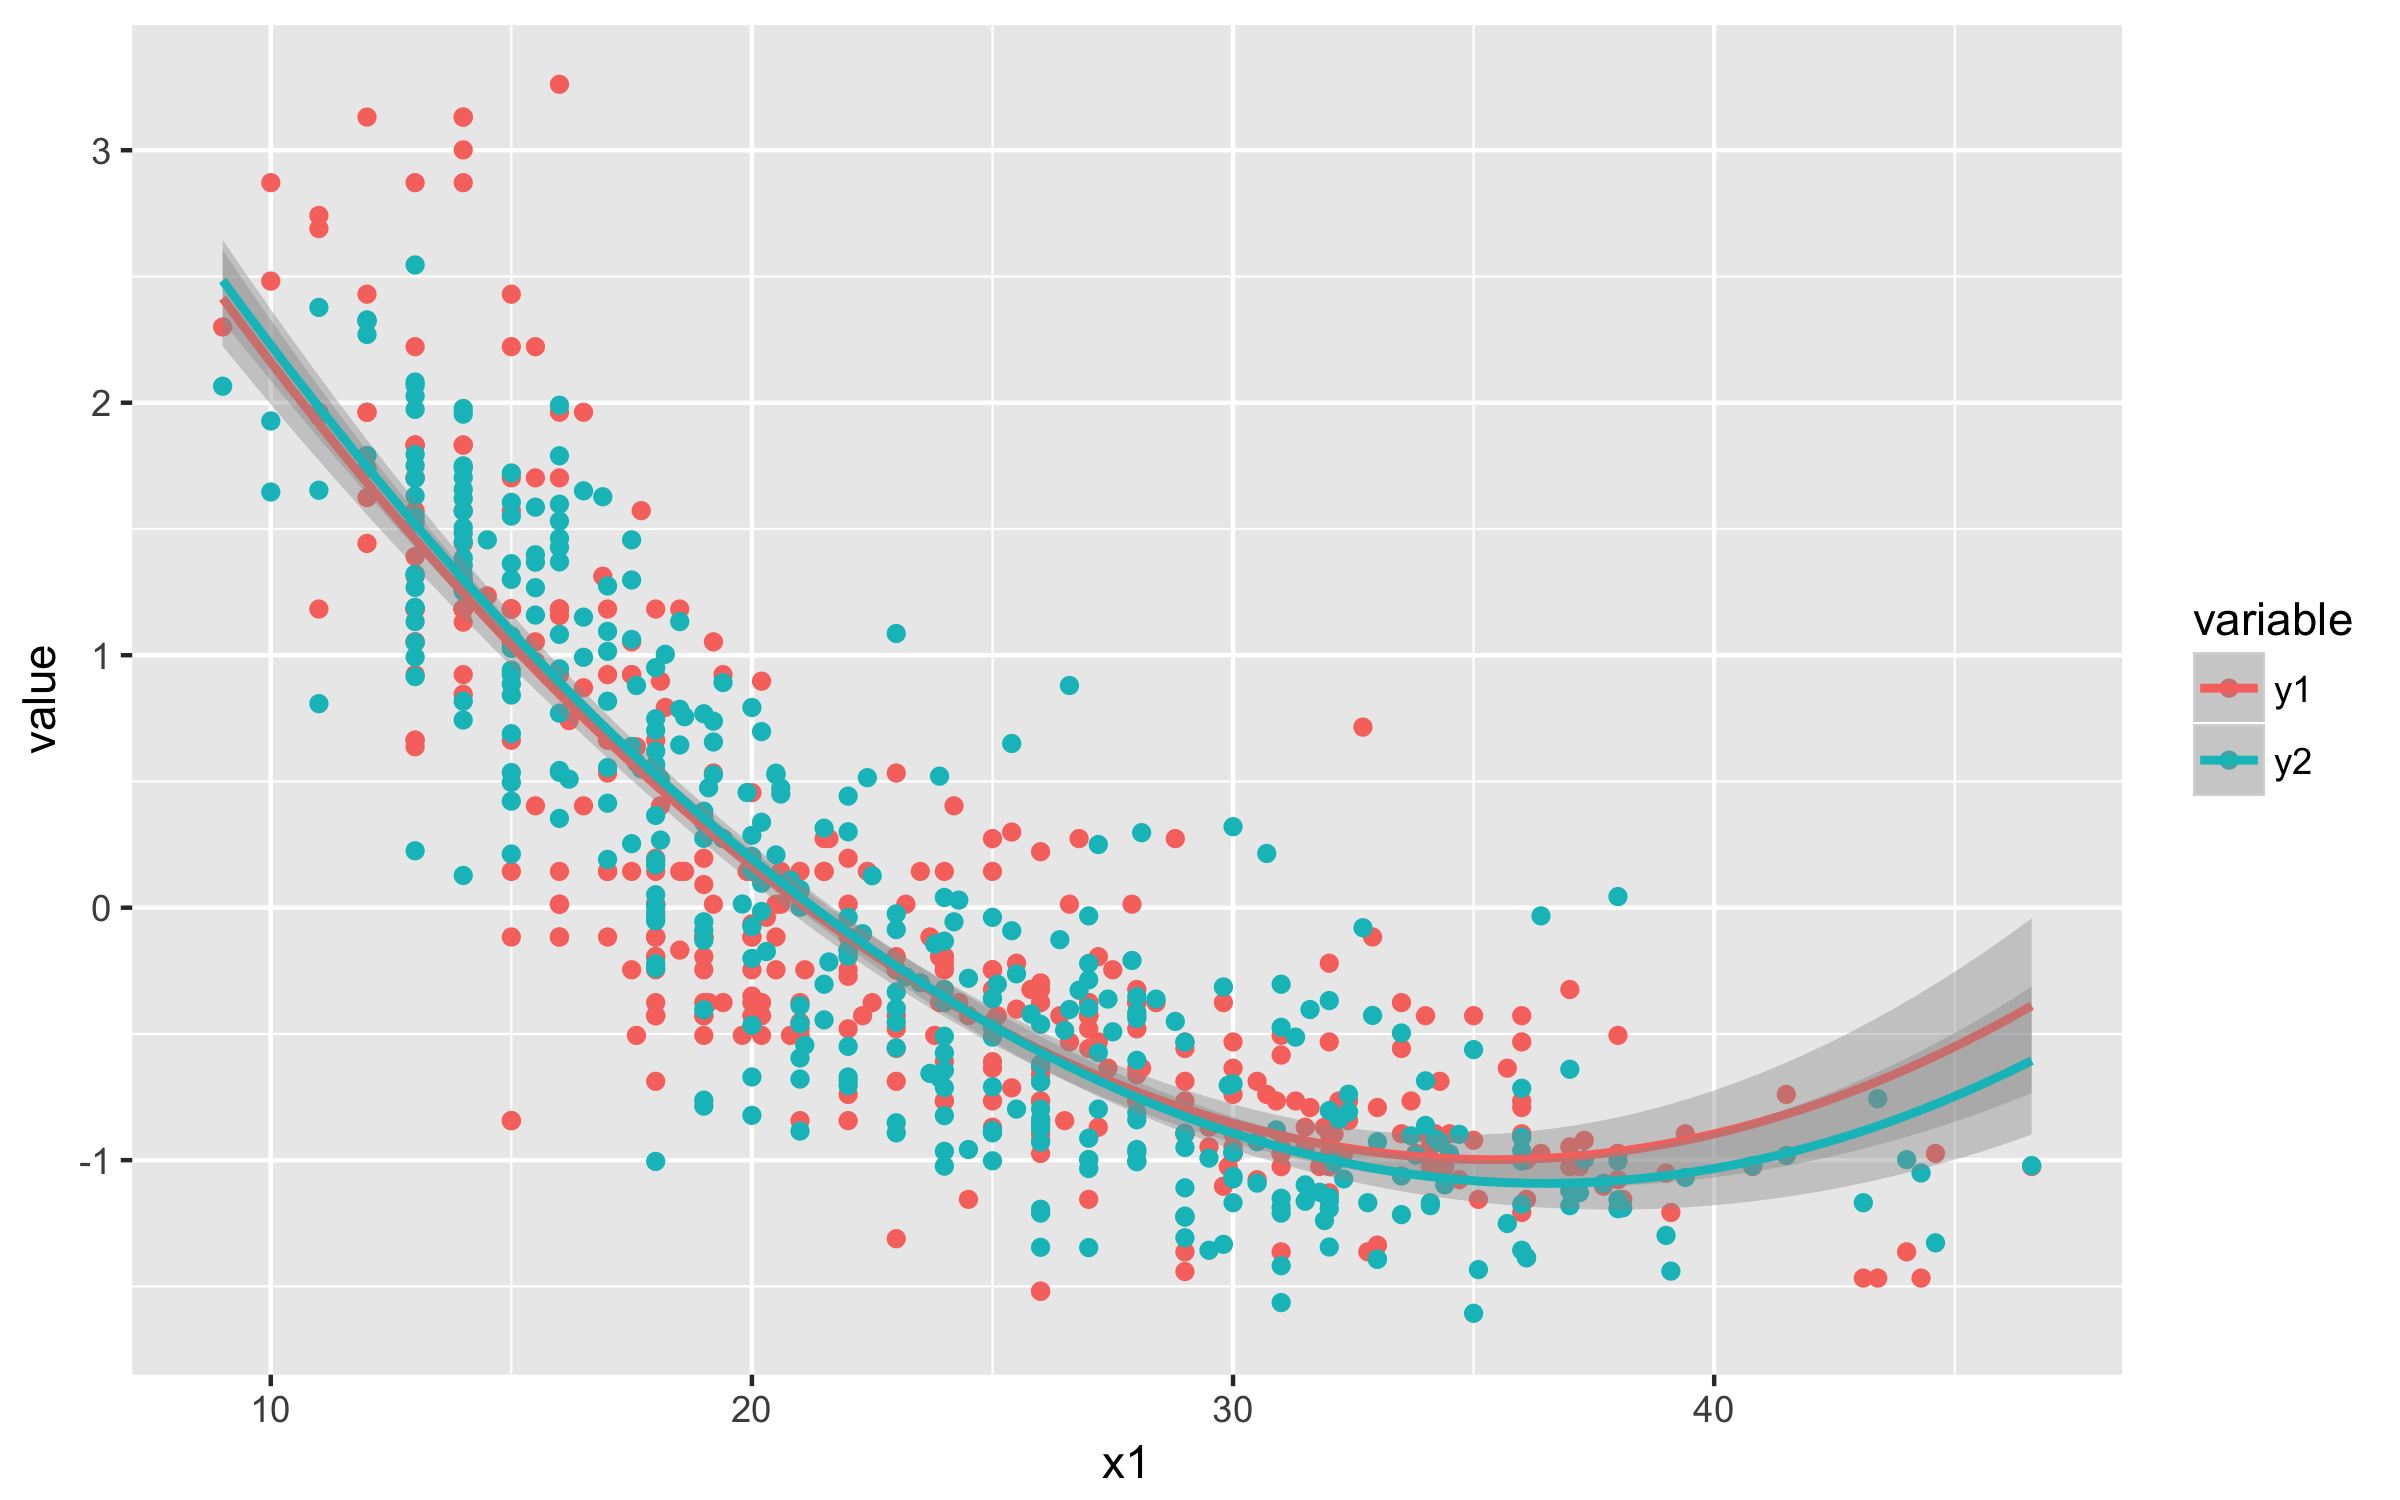
Or make long format table and then you will need just one call of stat_smooth() and geom_point().

library(tidyr)
df_long <- df %>% gather(variable, value, y1:y2)

ggplot(df_long, aes(x1, value, color = variable)) +
      geom_point() +
      stat_smooth(method = "lm", formula = y ~ x + I(x^2), size = 1)

enter image description here

Spoliation answered 13/3, 2017 at 12:56 Comment(0)

© 2022 - 2024 — McMap. All rights reserved.