ggplot2: Put multi-variable facet_wrap labels on one line
Asked Answered
T

3

24

I am using facet_wrap to split my scatter plot as

facet_wrap(x~y+z)

This generates 22 plots in my case as desired. However, label for each of those 22 plots is displayed in 3 rows (x, y and z) which unnecessarily consumes the space in the window and squishes the plots into a small area. I would rather want my plots to be bigger in size. Since variables y and z are short, I would like to display them in same row instead of two.

I looked into the labeller options but none of them seem to do what I would want. I would appreciate any suggestions here.

Tommi answered 10/5, 2016 at 17:9 Comment(0)
P
37

In this case you might also consider label_wrap_gen():

p <- ggplot(mtcars, aes(wt,mpg)) + geom_point() 
p + facet_wrap(cyl~am+vs, labeller = label_wrap_gen(multi_line=FALSE))

For more details see also here and here.

Puttier answered 17/5, 2016 at 9:28 Comment(0)
C
10

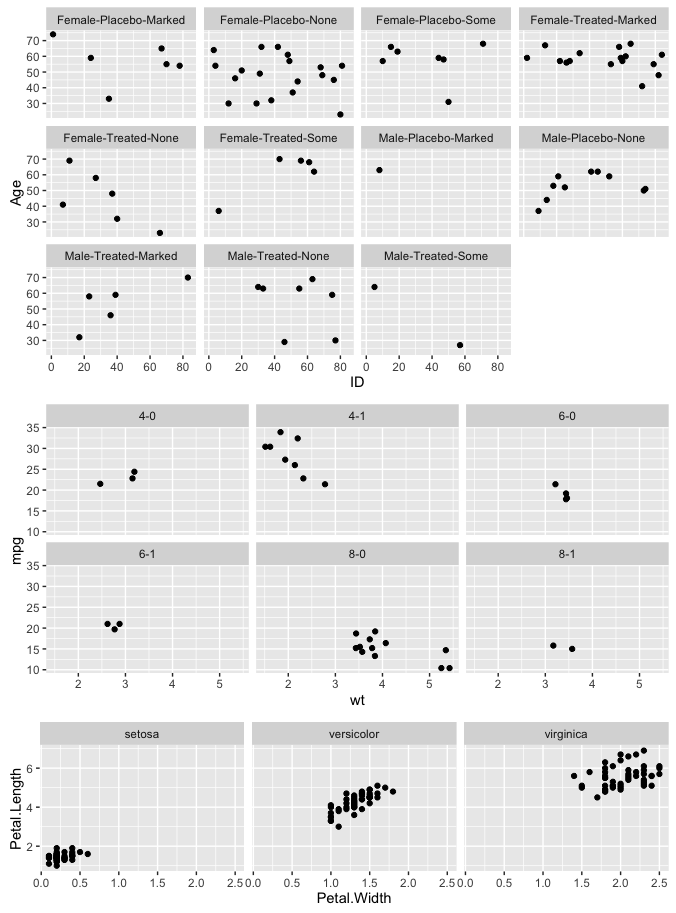
I'm not sure how to do this with a labeller function, but another option is to create a grouping variable that combines all three of your categorical variables into a single variable that can be used for faceting. Here's an example using the built-in mtcars data frame and the dplyr package for creating the new grouping variable on the fly. Following that is an update with a function that allows dynamic choice of from one to three faceting variables.

library(dplyr)

ggplot(mtcars %>% mutate(group = paste(cyl,am,vs, sep="-")), 
       aes(wt,mpg)) +
  geom_point() +
  facet_wrap(~group)

enter image description here

UPDATE: Regarding the comment about flexibility, the code below is a function that allows the user to enter the desired data frame and variable names, including dynamically choosing to facet on one, two, or three columns.

library(dplyr)
library(lazyeval)

mygg = function(dat, v1, v2, f1, f2=NA, f3=NA) {

  dat = dat %>% 
    mutate_(group = 
              if (is.na(f2)) {
                f1
              } else if (is.na(f3)) {
                interp(~paste(f1,f2, sep='-'), f1=as.name(f1), f2=as.name(f2))
              } else {
                interp(~paste(f1,f2,f3,sep='-'), f1=as.name(f1), f2=as.name(f2), f3=as.name(f3))
              })

  ggplot(dat, aes_string(v1,v2)) +
    geom_point() +
    facet_wrap(~group)
}

Now let's try out the function:

library(vcd) # For Arthitis data frame

mygg(Arthritis, "ID","Age","Sex","Treatment","Improved")
mygg(mtcars, "wt","mpg","cyl","am")
mygg(iris, "Petal.Width","Petal.Length","Species")

enter image description here

Cultigen answered 10/5, 2016 at 17:15 Comment(2)
Thank you, this sure works. However, I would like to find out if there is a way to do this using ggplot2 parameters. I may want to facet_wrap my plots using different variables and would also want to avoid redundancy in my data table which is already huge.Tommi
See updated answer. Also note that the code doesn't add any columns to the data frame object. The extra column is added only within the ggplot function and does not alter the data frame object itself.Cultigen
C
9

This was a top search result for me, so I am adding an answer with knowledge from 2022. ggplot's labeller() method now has a .multi_line argument, which, when FALSE, will comma-separate facet labels, including if you want to use a custom labeller.

library(tidyverse)

ggplot(mtcars, aes(wt,mpg)) +
    geom_point() +
    facet_wrap(~ cyl + gear + carb, labeller = 
        labeller(
            cyl = ~ paste("Cylinder: ", .),
            gear = ~ paste("Gear: ", .),
            carb = ~ paste("Carb: ", .),
            .multi_line = FALSE
        )
    )

Plot with single line facet titles

Christogram answered 19/5, 2022 at 21:5 Comment(0)

© 2022 - 2025 — McMap. All rights reserved.