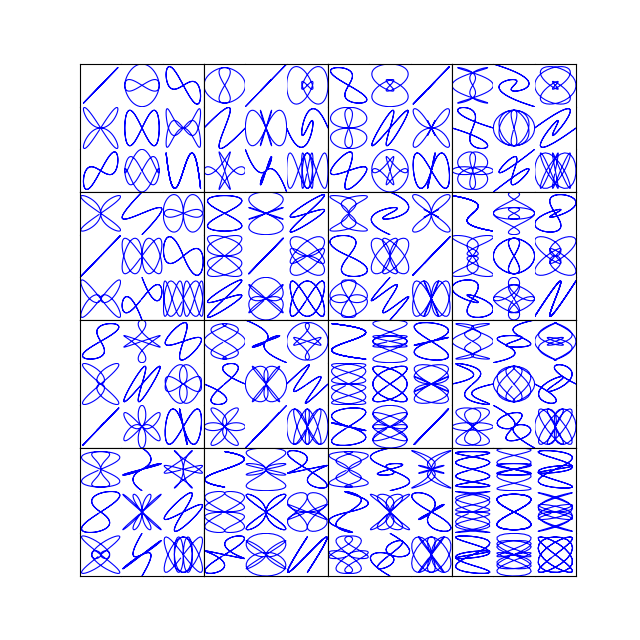
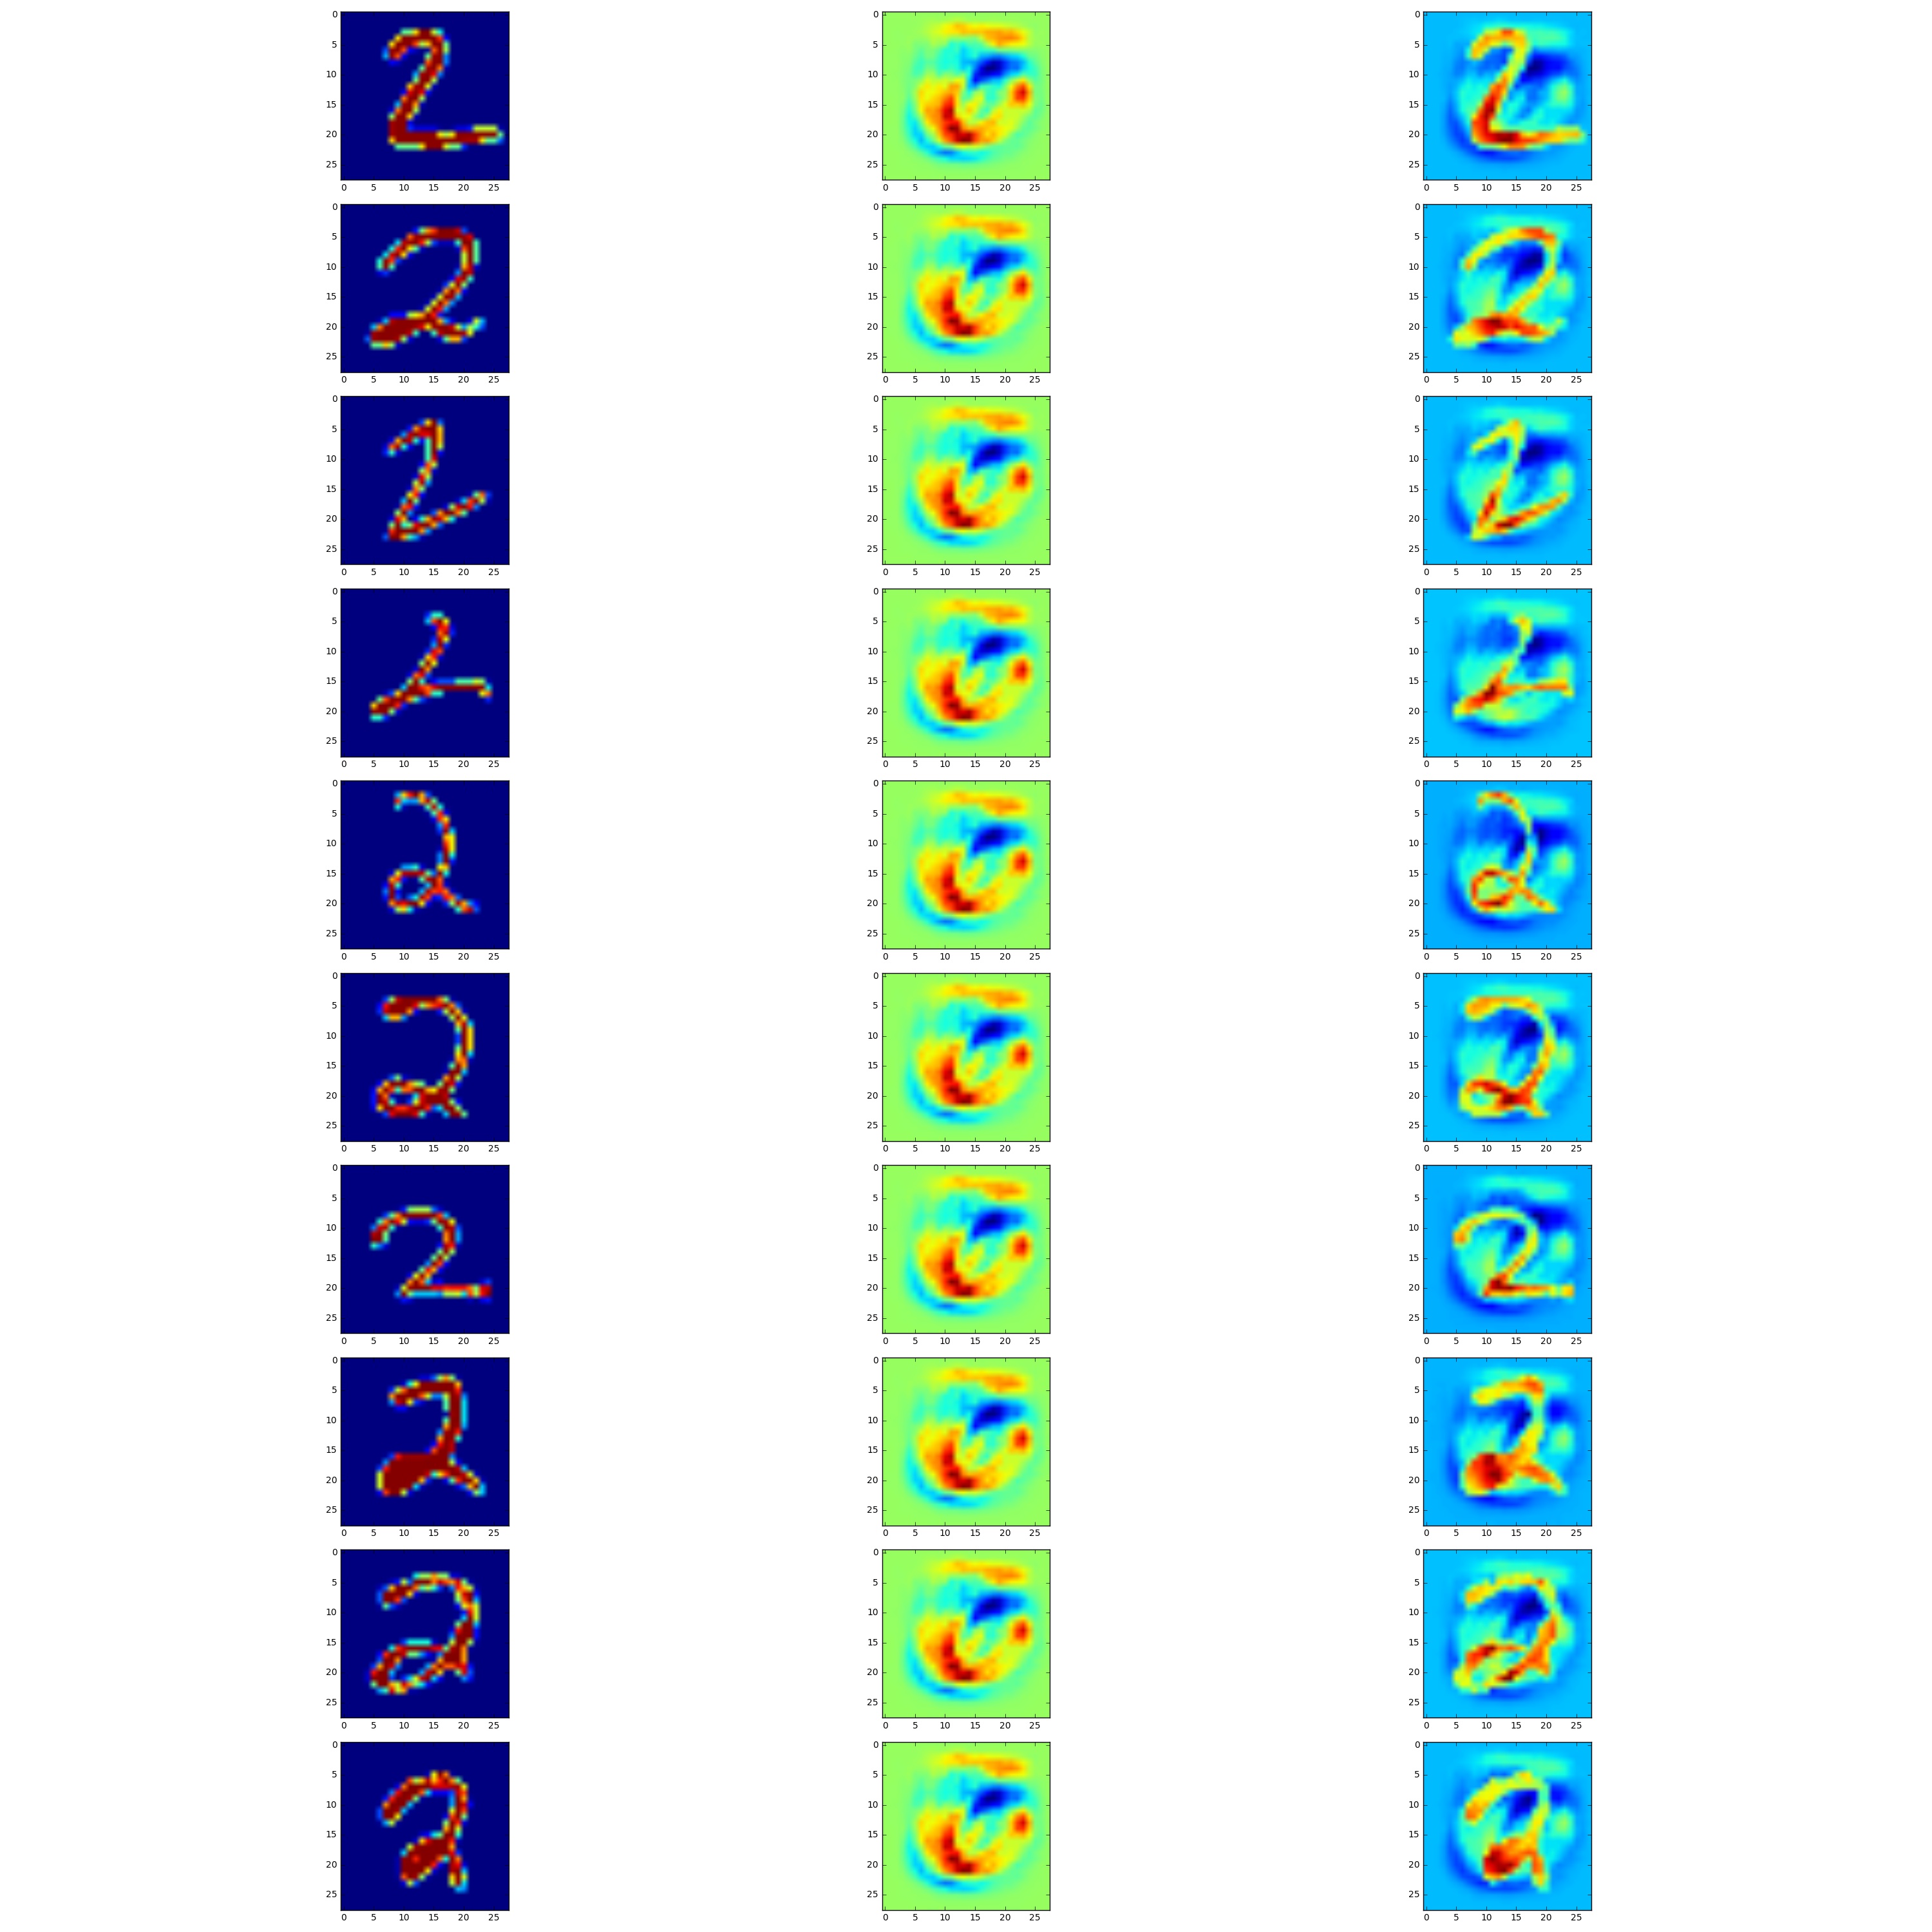
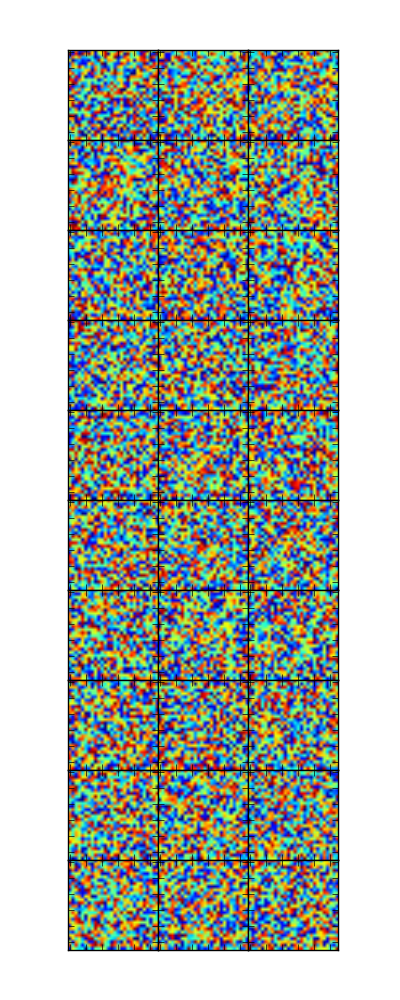
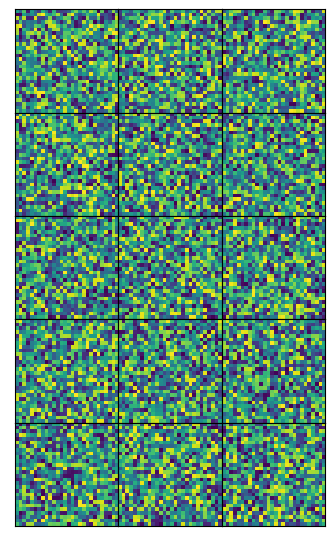
I am working on a project in which I need to put together a plot grid of 10 rows and 3 columns. Although I have been able to make the plots and arrange the subplots, I was not able to produce a nice plot without white space such as this one below from gridspec documentatation. .
.
I tried the following posts, but still not able to completely remove the white space as in the example image. Can someone please give me some guidance? Thanks!
Below is my code. The full script is here on GitHub. Note: images_2 and images_fool are both numpy arrays of flattened images with shape (1032, 10), while delta is an image array of shape (28, 28).
def plot_im(array=None, ind=0):
    """A function to plot the image given a images matrix, type of the matrix: \
    either original or fool, and the order of images in the matrix"""
    img_reshaped = array[ind, :].reshape((28, 28))
    imgplot = plt.imshow(img_reshaped)

# Output as a grid of 10 rows and 3 cols with first column being original, second being
# delta and third column being adversaril
nrow = 10
ncol = 3
n = 0

from matplotlib import gridspec
fig = plt.figure(figsize=(30, 30))
gs = gridspec.GridSpec(nrow, ncol, width_ratios=[1, 1, 1])

for row in range(nrow):
    for col in range(ncol):
        plt.subplot(gs[n])
        if col == 0:
            #plt.subplot(nrow, ncol, n)
            plot_im(array=images_2, ind=row)
        elif col == 1:
            #plt.subplot(nrow, ncol, n)
            plt.imshow(w_delta)
        else:
            #plt.subplot(nrow, ncol, n)
            plot_im(array=images_fool, ind=row)
        n += 1

plt.tight_layout()
#plt.show()
plt.savefig('grid_figure.pdf')


