CSS3 simple donut chart
Asked Answered
S

6

24

What I'm trying to do is create a simple donut chart. I'm currently using CSS(3) only but I don't know if it's possible without javascript.

What I have so far: http://jsfiddle.net/aBP5Q/

HTML:

<div class="donut-container" style="background: #9C0;">
    <div class="donut-inner">
        <div class="donut-label">HTML</div>
    </div>
</div>

CSS:

.donut-container {
    width: 150px;
    height: 150px;
    float: left;
    -webkit-border-radius: 75px;
    -moz-border-radius: 75px;
    border-radius: 75px;
    margin-right: 20px;
}

.donut-inner {
    width: 134px;
    height: 134px;
    position: relative;
    top: 8px;
    left: 8px;
    background: #FFF;
    -webkit-border-radius: 65px;
    -moz-border-radius: 65px;
    border-radius: 65px;
}

.donut-label {
    line-height: 130px;
    text-align: center;
    font-size: 20px;
}

I would like to display the green and blue colors as the precentage. So no green is 0% and full green (360 degrees) is 100%. Maybe even with a simple animation when the chart is loaded if its possible.

Your help is much appreciated.

Synagogue answered 11/12, 2013 at 17:22 Comment(4)
https://mcmap.net/q/581760/-css-how-to-create-circle-pie-canvas-like-this ? jsfiddle.net/pMJmF/1Arrack
San: The problem is I don't see any explaination/code. This way I don't know what exactly need for my simplistic donut chart. The example is nice and It's kinda what I'm looking for. Mr. Alien: I would like to use CSS only if possible. And the fiddle doesn't work on chrome.Synagogue
jasonK - when you look at San's link use Firebug in FF, or Developer tools in Chrome/safari to see the CSS styling on the circles.Susumu
@Susumu Yes I see it, the problem is that I don't know exactly what to use and what not. And is it true you need to make 2 rectangles for both halves in order to get the round progress effect?Synagogue
P
46

SVG for the win!

.item {
    position: relative;
    float: left;
}

.item h2 {
    text-align:center;
    position: absolute;
    line-height: 125px;
    width: 100%;
}

svg {
   -webkit-transform: rotate(-90deg);
    transform: rotate(-90deg);
}

.circle_animation {
  stroke-dasharray: 440; /* this value is the pixel circumference of the circle */
  stroke-dashoffset: 440;
}

.html .circle_animation {
    -webkit-animation: html 1s ease-out forwards;
    animation: html 1s ease-out forwards;
}

.css .circle_animation {
    -webkit-animation: css 1s ease-out forwards;
    animation: css 1s ease-out forwards;
}

@-webkit-keyframes html {
  to {
    stroke-dashoffset: 80; /* 50% would be 220 (half the initial value specified above) */
  }
}

@keyframes html {
  to {
    stroke-dashoffset: 80;
  }
}

@-webkit-keyframes css {
  to {
    stroke-dashoffset: 160;
  }
}

@keyframes css {
  to {
    stroke-dashoffset: 160;
  }
}
<div class="item html">
    <h2>HTML</h2>
    <svg width="160" height="160" xmlns="http://www.w3.org/2000/svg">
     <g>
      <title>Layer 1</title>
      <circle class="circle_animation" r="69.85699" cy="81" cx="81" stroke-width="8" stroke="#6fdb6f" fill="none"/>
     </g>
    </svg>
</div>

<div class="item css">
    <h2>CSS</h2>
    <svg width="160" height="160" xmlns="http://www.w3.org/2000/svg">
     <g>
      <title>Layer 1</title>
      <circle class="circle_animation" r="69.85699" cy="81" cx="81" stroke-width="8" stroke="#69aff4" fill="none"/>
     </g>
    </svg>
</div>

JSFiddle version


Here is a version with background circles as requested in the comments:

.item {
    position: relative;
    float: left;
}

.item h2 {
    text-align:center;
    position: absolute;
    line-height: 125px;
    width: 100%;
}

svg {
   -webkit-transform: rotate(-90deg);
    transform: rotate(-90deg);
}

.circle_animation {
  stroke-dasharray: 440; /* this value is the pixel circumference of the circle */
  stroke-dashoffset: 440;
}

.html .circle_animation {
    -webkit-animation: html 1s ease-out forwards;
    animation: html 1s ease-out forwards;
}

.css .circle_animation {
    -webkit-animation: css 1s ease-out forwards;
    animation: css 1s ease-out forwards;
}

@-webkit-keyframes html {
  to {
    stroke-dashoffset: 80; /* 50% would be 220 (half the initial value specified above) */
  }
}

@keyframes html {
  to {
    stroke-dashoffset: 80;
  }
}

@-webkit-keyframes css {
  to {
    stroke-dashoffset: 160;
  }
}

@keyframes css {
  to {
    stroke-dashoffset: 160;
  }
}
<div class="item html">
    <h2>HTML</h2>
    <svg width="160" height="160" xmlns="http://www.w3.org/2000/svg">
     <g>
      <title>Layer 1</title>
      <circle r="69.85699" cy="81" cx="81" stroke-width="8" stroke="#f2f2f2" fill="none"/>
      <circle class="circle_animation" r="69.85699" cy="81" cx="81" stroke-width="8" stroke="#6fdb6f" fill="none"/>
     </g>
    </svg>
</div>

<div class="item css">
    <h2>CSS</h2>
    <svg width="160" height="160" xmlns="http://www.w3.org/2000/svg">
     <g>
      <title>Layer 1</title>
      <circle r="69.85699" cy="81" cx="81" stroke-width="8" stroke="#f2f2f2" fill="none"/>
      <circle class="circle_animation" r="69.85699" cy="81" cx="81" stroke-width="8" stroke="#69aff4" fill="none"/>
     </g>
    </svg>
</div>

How does it work?

stroke-dasharray is used to define the 'pattern' a dashed line uses (MDN). By providing a single value you create a pattern with a dash of 440px and a space of 440px. (440px is roughly the circumference of the circle).

stroke-dashoffset effectively moves the starting point of the dash pattern (MDN).

A dash-offset of 220 (half of the stroke-dasharray) would produce a half-circle. 110 = quarter circle etc.

Piggyback answered 5/2, 2015 at 13:48 Comment(8)
Looking good! Asked this question a pretty long time ago, but I'll accept it. Thanks for sharing.Synagogue
What I don't understand is how you determine the percentage of 100? I don't understand how you would set to say 75% or 50%.Lugubrious
@JeremyMiller stroke-dasharray is used to define the 'pattern' a dashed line uses (MDN). By providing a single value you create a pattern with a dash of 440px and a space of 440px. (440px is roughly the circumference of the circle). stroke-dashoffset effectively moves the starting point of the dash pattern (MDN). A dash-offset of 220 (half of the stroke-dasharray) would produce a half-circle. 110 = quarter circle etc.Piggyback
Great example that works really well. However, it would be superb if there was an explanation into how it works. CheersTamberg
Works great for me... except on Internet Explorer. Adding the "-ms-" prefix to the appropriate directives with no luck. Does anyone have a modification to this solution that will work under IE?Beckham
This example was not compatible with IE 9-11(win7) at least. Here is the best donut chart built with CSS+HTM I have found so far codepen.io/thelifemgmt/pen/AbyhjHeddy
@Piggyback this is fantastic! Is there a way to create a grey circular background line behind the animating colors?Teliospore
If I understand this right, if you want to set it dynamic you have to change the key frames animation ? If that's the case this wouldn't be a good solution for something like a dashboard. Becase keyframes animation can't be changed inline...Toggery
H
10

This answer is only possible because of Turnip's answer, but I made a few significant changes, and I'll explain how it works as well:

.donutContainer {
    position: relative;
    float: left;
}

.donutContainer h2 {
    text-align:center;
    position: absolute;
    line-height: 125px;
    width: 100%;
}

svg {
    transform: rotate(-90deg);
}

.donut {
  stroke-dasharray: 440;
  -webkit-animation: donut 1s ease-out forwards;
  animation: donut 1s ease-out forwards;
}

@-webkit-keyframes donut {
  from {
    stroke-dashoffset: 440;
  }
}

@keyframes donut {
  from {
    stroke-dashoffset: 440;
  }
}
<div class="donutContainer">
    <h2>donut</h2>
    <svg width="160" height="160" xmlns="http://www.w3.org/2000/svg">
     <g>
      <title>Layer 1</title>
      <circle id="circle" style="stroke-dashoffset: 160;/* 160 of 440 */" class="donut" r="69.85699" cy="81" cx="81" stroke-width="8" stroke="#69aff4" fill="none"/>
     </g>
    </svg>
</div>
<div class="donutContainer">
    <h2>donut 2</h2>
    <svg width="160" height="160" xmlns="http://www.w3.org/2000/svg">
     <g>
      <title>Layer 1</title>
      <circle id="circle" style="stroke-dashoffset: 220;/* 220 of 440 */" class="donut" r="69.85699" cy="81" cx="81" stroke-width="8" stroke="#FEC007" fill="none"/>
     </g>
    </svg>
</div>

Because the animation uses from instead of to to create the animation, browsers that don't support the animation will show the donut chart complete, instead of not at all. This also makes it possible to change the colored in portion of the donut chart with just inline CSS, and the same single CSS animation can work for any number of donut charts.

An explaination for the svg stuff:

stroke-dasharray: In this case, basically the total circumference of the circle.

stroke-dashoffset: the portion of the circle that is colored in. Zero (0) means all colored in (100%), 440 (or whatever you set the circumference) for none of it colored in (0%)

Attributes on the circle element:

r: radius of the circle

cx: "center X". the center of the circle (X coordinate from bottom left of svg element)

cy: "center Y". the center of the circle (Y coordinate from bottom left of svg element)

stroke-width: width of the stroke that will draw the donut

stroke: color of the donut

Headspring answered 10/1, 2018 at 6:50 Comment(0)
S
8

i wrote this as a comment reply but it was too long :

hm... well, here is a fiddle for the second circle http://jsfiddle.net/LgtV2/ .... it has 3 pie parts. the first circle (100%) has 5 parts. you should play with the fiddle to learn how it works and so you can replicate it. i've never done this before and am just looking at link San posted, but it looks like this just uses multiple Divs with the css3 TRANSFORM to form the curves, and the pseudo selectors :before and :after for animations. The animations occur as the page itself is loading... EG: :before div1 loads it has a transform of 5, it loads and has a transform of 8, :after it loads it has a transform of 11.

code:

<div class="half_pie">
    <div class="half_part_pie_one half_bar_color half_percentage" data-percentage="35"></div>
    <div class="half_part_pie_two"></div>
    <div class="half_part_pie_three"></div> <span class="half_pie_icon iconfont-android"></span>

</div>

/*percentage STEPS (do not touch)*/
 .full_percentage[data-percentage="100"] {
    -webkit-transform: rotate(180deg);
    -moz-transform: rotate(180deg);
    -o-transform: rotate(180deg);
    transform: rotate(180deg);
}
.full_percentage[data-percentage="95"] {
    -webkit-transform: rotate(170deg);
    -moz-transform: rotate(170deg);
    -o-transform: rotate(170deg);
    transform: rotate(170deg);
}
.full_percentage[data-percentage="90"] {
    -webkit-transform: rotate(155deg);
    -moz-transform: rotate(155deg);
    -o-transform: rotate(155deg);
    transform: rotate(155deg);
}
.full_percentage[data-percentage="85"] {
    -webkit-transform: rotate(125deg);
    -moz-transform: rotate(125deg);
    -o-transform: rotate(125deg);
    transform: rotate(125deg);
}
.full_percentage[data-percentage="80"] {
    -webkit-transform: rotate(110deg);
    -moz-transform: rotate(110deg);
    -o-transform: rotate(110deg);
    transform: rotate(110deg);
}
.full_percentage[data-percentage="75"] {
    -webkit-transform: rotate(90deg);
    -moz-transform: rotate(90deg);
    -o-transform: rotate(90deg);
    transform: rotate(90deg);
}
.full_percentage[data-percentage="70"] {
    -webkit-transform: rotate(70deg);
    -moz-transform: rotate(70deg);
    -o-transform: rotate(70deg);
    transform: rotate(70deg);
}
.full_percentage[data-percentage="65"] {
    -webkit-transform: rotate(55deg);
    -moz-transform: rotate(55deg);
    -o-transform: rotate(55deg);
    transform: rotate(55deg);
}
.full_percentage[data-percentage="60"] {
    -webkit-transform: rotate(35deg);
    -moz-transform: rotate(35deg);
    -o-transform: rotate(35deg);
    transform: rotate(35deg);
}
.full_percentage[data-percentage="55"] {
    -webkit-transform: rotate(20deg);
    -moz-transform: rotate(20deg);
    -o-transform: rotate(20deg);
    transform: rotate(20deg);
}
.full_percentage[data-percentage="50"] {
    -webkit-transform: rotate(0deg);
    -moz-transform: rotate(0deg);
    -o-transform: rotate(0deg);
    transform: rotate(0deg);
}
.half_percentage[data-percentage="50"] {
    -webkit-transform: rotate(180deg);
    -moz-transform: rotate(180deg);
    -o-transform: rotate(180deg);
    transform: rotate(180deg);
}
.half_percentage[data-percentage="45"] {
    -webkit-transform: rotate(170deg);
    -moz-transform: rotate(170deg);
    -o-transform: rotate(170deg);
    transform: rotate(170deg);
}
.half_percentage[data-percentage="40"] {
    -webkit-transform: rotate(155deg);
    -moz-transform: rotate(155deg);
    -o-transform: rotate(155deg);
    transform: rotate(155deg);
}
.half_percentage[data-percentage="35"] {
    -webkit-transform: rotate(125deg);
    -moz-transform: rotate(125deg);
    -o-transform: rotate(125deg);
    transform: rotate(125deg);
}
.half_percentage[data-percentage="30"] {
    -webkit-transform: rotate(110deg);
    -moz-transform: rotate(110deg);
    -o-transform: rotate(110deg);
    transform: rotate(110deg);
}
.half_percentage[data-percentage="25"] {
    -webkit-transform: rotate(90deg);
    -moz-transform: rotate(90deg);
    -o-transform: rotate(90deg);
    transform: rotate(90deg);
}
.half_percentage[data-percentage="20"] {
    -webkit-transform: rotate(70deg);
    -moz-transform: rotate(70deg);
    -o-transform: rotate(70deg);
    transform: rotate(70deg);
}
.half_percentage[data-percentage="15"] {
    -webkit-transform: rotate(55deg);
    -moz-transform: rotate(55deg);
    -o-transform: rotate(55deg);
    transform: rotate(55deg);
}
.half_percentage[data-percentage="10"] {
    -webkit-transform: rotate(35deg);
    -moz-transform: rotate(35deg);
    -o-transform: rotate(35deg);
    transform: rotate(35deg);
}
.half_percentage[data-percentage="5"] {
    -webkit-transform: rotate(20deg);
    -moz-transform: rotate(20deg);
    -o-transform: rotate(20deg);
    transform: rotate(20deg);
}
.half_percentage[data-percentage="0"] {
    -webkit-transform: rotate(0deg);
    -moz-transform: rotate(0deg);
    -o-transform: rotate(0deg);
    transform: rotate(0deg);
}
/*
 *
 * THE SECOND EXAMPLE
 * the second example for a max percentuage of 50% in this case
 *
 */

/*COLOR and STYLES (note: you can use gradients for the class full_bar_color)*/
 .half_bar_color {
    background: #3498db;
}
/*start chart pie code*/
 .half_pie {
    position: relative;
    width: 200px;
    height: 200px;
    margin: 0 auto;
    background: #fff;
    -webkit-border-radius: 100%;
    -moz-border-radius: 100%;
    -o-border-radius: 100%;
    border-radius: 100%;
}
/*the background white circular color*/
 .half_pie:before {
    content:'';
    display: block;
    position: absolute;
    z-index: -1;
    width: 220px;
    height: 220px;
    top: -10px;
    left: -10px;
    background: #fff;
    -webkit-border-radius: 100%;
    -moz-border-radius: 100%;
    -o-border-radius: 100%;
    border-radius: 100%;
}
/*color white #fff to fix the rendering problem*/
 .half_pie:after {
    content:'';
    display: block;
    position: absolute;
    z-index: 10;
    width: 198px;
    height: 198px;
    top: 1px;
    left: 1px;
    -webkit-box-shadow: 0px 0px 0px 2px #fff, inset 0 0 5px rgba(0, 0, 0, 0.1);
    -moz-box-shadow: 0px 0px 0px 2px #fff, inset 0 0 5px rgba(0, 0, 0, 0.1);
    box-shadow: 0px 0px 0px 2px #fff, inset 0 0 5px rgba(0, 0, 0, 0.1);
    -webkit-border-radius: 100%;
    -moz-border-radius: 100%;
    -o-border-radius: 100%;
    border-radius: 100%;
}
/*the icon*/
 span.half_pie_icon {
    position: absolute;
    z-index: 5;
    top: 25px;
    left: 25px;
    width: 150px;
    height: 150px;
    font-size: 3em;
    line-height: 150px;
    text-align: center;
    color: #e0e0e0;
    background: #fff;
    -webkit-box-shadow: 0px 0px 10px 0px rgba(0, 0, 0, 0.1);
    -moz-box-shadow: 0px 0px 10px 0px rgba(0, 0, 0, 0.1);
    box-shadow: 0px 0px 10px 0px rgba(0, 0, 0, 0.1);
    -webkit-border-radius: 100%;
    -moz-border-radius: 100%;
    -o-border-radius: 100%;
    border-radius: 100%;
}
/*ONE*/
 .half_part_pie_one {
    position: absolute;
    z-index: 1;
    width: 100%;
    height: 100%;
    -webkit-border-radius: 100%;
    -moz-border-radius: 100%;
    -o-border-radius: 100%;
    border-radius: 100%;
    clip: rect(0px 100px 200px 0px);
}
/*TWO*/
 .half_part_pie_two {
    position: absolute;
    z-index: 2;
    width: 100%;
    height: 100%;
    background: #fff;
    -webkit-border-radius: 100%;
    -moz-border-radius: 100%;
    -o-border-radius: 100%;
    border-radius: 100%;
    clip: rect(0px 100px 200px 0px);
}
/*THREE*/
 .half_part_pie_three {
    position: absolute;
    z-index: 3;
    width: 100%;
    height: 100%;
    background: #fff;
    -webkit-border-radius: 100%;
    -moz-border-radius: 100%;
    -o-border-radius: 100%;
    border-radius: 100%;
    clip: rect(0px 200px 200px 100px);
    -webkit-animation: half_third 4s linear;
    -moz-animation: half_third 4s linear;
    -o-animation: half_third 4s linear;
    animation: half_third 4s linear;
    opacity: 0;
}
/*THIRD animation*/
 @-webkit-keyframes half_third {
    0% {
        opacity: 1;
        -webkit-transform: rotate(0deg);
    }
    100% {
        opacity: 1;
        -webkit-transform: rotate(180deg);
    }
}
@-moz-keyframes half_third {
    0% {
        opacity: 1;
        -moz-transform: rotate(0deg);
    }
    100% {
        opacity: 1;
        -moz-transform: rotate(180deg);
    }
}
@-o-keyframes half_third {
    0% {
        opacity: 1;
        -o-transform: rotate(0deg);
    }
    100% {
        opacity: 1;
        -o-transform: rotate(180deg);
    }
}
@keyframes half_third {
    0% {
        opacity: 1;
        transform: rotate(0deg);
    }
    100% {
        opacity: 1;
        transform: rotate(180deg);
    }
}
Susumu answered 11/12, 2013 at 21:4 Comment(0)
E
7

I have modified a snippet I found on the web to make a simple doughnut chart using only HTML and CSS, here is the result:

.block {
  margin: 25px 25px 0 0;
  background: #394264;
  border-radius: 5px;
  float: left;
  width: 300px;
  overflow: hidden;
}

.donut-chart-block {
  overflow: hidden;
}

.donut-chart {
  position: relative;
  width: 200px;
  height: 200px;
  margin: 2rem auto;
  border-radius: 100%
}

.donut-chart .center {
  background: #394264;
  position: absolute;
  top: 30px;
  left: 30px;
  height: 140px;
  width: 140px;
  border-radius: 70px;
}

.clip {
  border-radius: 50%;
  clip: rect(0px, 200px, 200px, 100px);
  height: 100%;
  position: absolute;
  width: 100%;
}

.item {
  border-radius: 50%;
  clip: rect(0px, 100px, 200px, 0px);
  height: 100%;
  position: absolute;
  width: 100%;
  font-family: monospace;
  font-size: 1.5rem;
}

#section1 {
  transform: rotate(0deg);
}

#section1 .item {
  background-color: #E64C65;
  transform: rotate(76deg);
}

#section2 {
  transform: rotate(76deg);
}

#section2 .item {
  background-color: #11A8AB;
  transform: rotate(140deg);
}

#section3 {
  transform: rotate(215deg);
}

#section3 .item {
  background-color: #4FC4F6;
  transform: rotate(113deg);
}

#section4 {
  transform: rotate(-32deg);
}

#section4 .item {
  background-color: #FCB150;
  transform: rotate(32deg);
}
<div class="container">
  <div class="donut-chart-block block">
    <div class="donut-chart">
      <div id="section1" class="clip">
        <div class="item" data-rel="21"></div>
      </div>
      <div id="section2" class="clip">
        <div class="item" data-rel="39"></div>
      </div>
      <div id="section3" class="clip">
        <div class="item" data-rel="31"></div>
      </div>
      <div id="section4" class="clip">
        <div class="item" data-rel="9"></div>
      </div>
      <div class="center"></div>
    </div>
  </div>
</div>

Decided to post it here as an alternative to the other answers. Cheers!

Electrodeposit answered 14/4, 2016 at 13:19 Comment(1)
anyhting over 50deg get's confused!Fevre
I
3

In case you need to create a donut chart animation (just plain css) and also need multiple colors for it then check the codepen example I have created.

http://codepen.io/hilar47/pen/RprXev

<div class="container">
  <div class="donut-chart-block block"> 
    <div class="donut-chart">
        <div id="part1" class="portion-block"><div class="circle"></div></div>
        <div id="part2" class="portion-block"><div class="circle"></div></div>
        <div id="part3" class="portion-block"><div class="circle"></div></div>
        <p class="center"></p>        
    </div>

Inculcate answered 2/3, 2017 at 13:31 Comment(0)
M
0

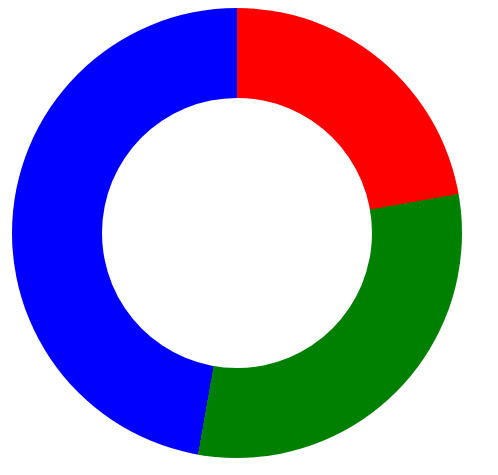
This is my trying.

<html>  
<style>
#donut {
  /* (A1) CIRCLE */
  width: 300px; height: 300px;
  border-radius: 50%;
 
  /* (A2) SEGMENTS */
  background: conic-gradient(
    red 0deg 80deg,
    green 80deg 190deg,
    blue 190deg 360deg
  );
}

#donut::before {
  content: "";
  width: 180px; height: 180px;
  border-radius: 50%;
  background: #fff;
}
 
/* (B2) "CONVERT PIE TO DONUT" - CENTER SMALLER CIRCLE */
#donut {
  display: flex;
  align-items: center;
  justify-content: center;
}
</style> 
<body>  
<div id="donut"></div>

</body>
</html>

Resulted donut chart is as follows:

enter image description here

Massicot answered 21/6 at 21:6 Comment(1)
So you tried it from this site. https://code-boxx.com/donut-chart-html-css/ with exact code? It is always good to give credit to the original author.Hintz

© 2022 - 2024 — McMap. All rights reserved.