Chart.js - Hover labels to display data for all data points on x-axis
Asked Answered
F

6

24

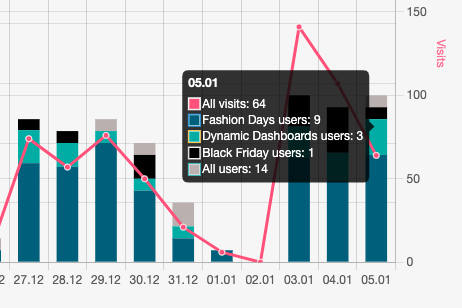
I have a graph with multiple data points / lines. Currently, if you hover near a data point, it will display the label/value for that point.

What I'd like is the following: when you hover anywhere on the chart, it will display the labels + values for all data points at that x-value simultaneously in a single label.

For example, let's take the given datasets:

Date (x-labels): ['Jan 01','Jan 02','Jan 03']
Apples Sold: [3,5,1]
Oranges Sold: [0,10,2]
Gallons of Milk Sold: [5,7,4]

When you hover over the middle of the graph, above the 'Jan 02' vertical space, the label should display:

Jan 02
-----------------------
Apples Sold: 5
Oranges Sold: 10
Gallons of Milk Sold: 7

Is there a simple way to accomplish this?

Thanks.

Funnyman answered 1/3, 2018 at 22:29 Comment(1)
The answer of baburao is correct and complete; please accept it.Hoopla
M
67

Is there a simple way to accomplish this?

YES !! There is a quite straightforward way to accomplish this. If you would have read the documentation, you could have found that pretty easily.

Anyway, basically you need to set the tooltips mode to index in your chart options, in order to accomplish the behavior you want.

...
options: {
   tooltips: {
      mode: 'index'
   }
}
...

Additionally, you probably want to set the following:

...
options: {
   tooltips: {
      mode: 'index',
      intersect: false
   },
   hover: {
      mode: 'index',
      intersect: false
   }
}
...

This will make it so all of the expected hover/label interactions will occur when hovering anywhere on the graph at the nearest x-value.

From the Documentation :

# index
Finds item at the same index. If the intersect setting is true, the first intersecting item is used to determine the index in the data. If intersect false the nearest item, in the x direction, is used to determine the index.

Here is a working example :

var ctx = document.getElementById('canvas').getContext('2d');
var chart = new Chart(ctx, {
   type: 'line',
   data: {
      labels: ['Jan 01', 'Jan 02', 'Jan 03'],
      datasets: [{
         label: 'Apples Sold',
         data: [3, 5, 1],
         borderColor: 'rgba(255, 99, 132, 0.8)',
         fill: false
      }, {
         label: 'Oranges Sold',
         data: [0, 10, 2],
         borderColor: 'rgba(255, 206, 86, 0.8)',
         fill: false
      }, {
         label: 'Gallons of Milk Sold',
         data: [5, 7, 4],
         borderColor: 'rgba(54, 162, 235, 0.8)',
         fill: false
      }]
   },
   options: {
      tooltips: {
         mode: 'index',
         intersect: false
      },
      hover: {
         mode: 'index',
         intersect: false
      }
   }
});
<script src="https://cdnjs.cloudflare.com/ajax/libs/Chart.js/2.7.2/Chart.min.js"></script>
<canvas id="canvas"></canvas>
Mithridate answered 4/3, 2018 at 10:39 Comment(9)
Thanks, that's exactly what I was looking for. Now I just need to figure out how to set intersect to false and 1) have the intersect points display and 2) make the animation less jumpy.Funnyman
JFYI: It was declined by the Community, not me (you can see here) ... Although, I think it makes sense, as your edit didn't really address the original question. However I can still Approve your edit if you like.. let me know :)Mithridate
Well, if you compare the examples, I would argue that my edit certainly makes the answer more complete. I don't think many people would prefer the behavior from Code Snippet "A" over Code Snippet "B". It just seems so stackoverflowy that the improved upon answer was rejected.Funnyman
Anyhow, I Approved your edit. Good Luck with your project :-)Mithridate
@Funnyman - Edits are not for fixing code snippets to improve the written code in the answer, edits are to improve the answer in general to provide better readability (such as someone not knowing how to format code properly on the page). If you have better code snippets, answer the question yourself instead of editing. A better edit would have been to replace the answers snarky and superfluous "If you would have read the documentation, you could have found that pretty easily." with something like "The documentation can be found here."Stepfather
This is not working in latest version, any idea?Tombac
with 3.3.2, put tooltips in plugin and change tooltips to tooltip. documentation and example: stackoverflow.com/a/67827146Detention
@Detention It's a shame your comment gets hidden by default because this is the most helpful piece of information for anyone who is using chartJs 3Shandy
I read the documentation and unfortunately my peanut sized brain was not able to connect the dots and draw the conclusions you did OP. Thanks.Gonadotropin
D
11

For Chart.js 3.3.2, you can use @baburao's approach with a few changes. You can check the documentation. Put tooltip in plugins. Example:

...
options: {
    plugins: {
        tooltip: {
            mode: 'nearest',
            intersect: false
        }
    }
}
...
Detention answered 26/6, 2021 at 3:31 Comment(2)
This was a life saver. This should be the new accepted answer. Thank you so much. EDIT: One note, I couldn't get it to work with mode: 'nearest' but instead mode: 'index' like the original answer. But the rest of this is gold.Shandy
As Andy said, this should be the new accepted answer in 2021 assuming you are using a modern version of Chart.js. Worked exactly as expected with Chart.js 3.5.1Documentation
J
3

I know this is an old post, but in a time I needed to divide a bar on multiple datasets, but the labels to be keeped as original values:

eg:

dataset 1: Totals: 10 15 10 
dataset 2: Red: 4 5 9 
dataset 3: Blue: 4 2 1

In my chart I want to show the "Totals" bar and to collor a part of it in red/blue or "the rest" (which is Totals color). I'll don't write the code to modify the datasets, but I'll complete @busterroni answer for chartjs v3+

plugins: {
   tooltip: {
     mode: 'index',
     intersect: false,
     callbacks: {
       label: (item) => item.dataset.label + ': ' + 
          this.originalValues[item.datasetIndex].data[item.dataIndex]
     }
   }
}

ChartJS example

Julide answered 5/1, 2022 at 9:7 Comment(0)
S
0

I use "chart.js": "^4.2.1" and this works for me:

...
options: {
    plugins: {
        tooltip: {
            mode: 'x',
            intersect: false
        }
    }
}
...

mode: 'nearest'
will not work because it will show only the nearset point and not all the points for the specific x-axis

Subplot answered 5/6, 2023 at 12:33 Comment(0)
R
-1

You could try using JavaScript to track the users mouse and based on the position, return the data at that vertice.

document.querySelector('.button').onmousemove = (e) => {
  const x = e.pageX - e.target.offsetLeft
  const y = e.pageY - e.target.offsetTop
  e.target.style.setProperty('--x', `${ x }px`)
  e.target.style.setProperty('--y', `${ y }px`)
 
}
Refill answered 1/3, 2018 at 22:40 Comment(1)
This is a very poor way of doing this and is extremely unreliable.Stepfather
B
-1

You can achieve this after plotting the data like this: Html

<div class="container">
  <h2>Chart.js — Line Chart Demo</h2>
  <div>
    <canvas id="myChart"></canvas>
  </div>
</div>
<script src="https://cdnjs.cloudflare.com/ajax/libs/Chart.js/2.1.4/Chart.min.js"> 
</script>

CSS

.container {
  width: 80%;
  margin: 15px auto;
}

Javascript

var ctx = document.getElementById('myChart').getContext('2d');
function convert(str) {
  var date = new Date(str),
    mnth = ("0" + (date.getMonth() + 1)).slice(-2),
    day = ("0" + date.getDate()).slice(-2);
  return [date.getFullYear(), mnth, day].join("-");
}
var date = ["Tue Jun 25 2019 00:00:00 GMT+0530 (India Standard Time)"];
 var y1 = [12];
 var y2 = [32];
 var y3 = [7];
var dataPoints1 = [], dataPoints2 = [], dataPoints3 = [], datep=[];
console.log(date.length)
if(date.length=="1"){
var myChart = new Chart(ctx, {
  type: 'line',
  data: {
    labels: ["",convert(date[0]),""],
    datasets: [{
      label:"Tweets",
      backgroundColor: "rgba(153,255,51,0.4)",
      fill:false,
      borderColor:"rgba(153,255,51,0.4)",
      data: [null,y1[0],null]
    }, {
      label:"Retweets",
      backgroundColor: "rgba(255,153,0,0.4)",
      fill:false,
      borderColor:"rgba(255,153,0,0.4)",
      data: [null,y2[0],null]
    },{
      label:"Favourites",
      backgroundColor: "rgba(197, 239, 247, 1)",
      fill:false,
      borderColor:"rgba(197, 239, 247, 1)",
      data:[null,y3[0],null]
      }
      ]
  },
  options: {
         scales: {
            xAxes: [{
               gridLines: {
                  display: false
               }
            }],
            yAxes: [{
               ticks: {
                  display: true
               },
               gridLines: {
                  display: false,
               // drawBorder: false //maybe set this as well
               }
            }]
         },
        }
});}
else{
for (var i = 0; i < date.length; i++) {
  datep.push(convert(date[i]))
  dataPoints1.push(y1[i]); 
  dataPoints2.push(y2[i]); 
  dataPoints3.push(y3[i]); 
}
console.log(datep)
var myChart = new Chart(ctx, {
  type: 'line',
  data: {
    labels: datep,
    datasets: [{
      label:"Tweets",
      backgroundColor: "rgba(153,255,51,0.4)",
      fill:false,
      borderColor:"rgba(153,255,51,0.4)",
      data: dataPoints1
    }, {
      label:"Retweets",
      backgroundColor: "rgba(255,153,0,0.4)",
      fill:false,
      borderColor:"rgba(255,153,0,0.4)",
      data: dataPoints2
    },{
      label:"Favourites",
      backgroundColor: "rgba(197, 239, 247, 1)",
      fill:false,
      borderColor:"rgba(197, 239, 247, 1)",
      data:dataPoints3
      }
      ]
  },
  options: {
         scales: {
            xAxes: [{
               gridLines: {
                  display: false
               }
            }],
            yAxes: [{
               ticks: {
                  display: true
               },
               gridLines: {
                  display: false,
               // drawBorder: false //maybe set this as well
               }
            }]
         },
        }
});
}

or chk this fiddle https://jsfiddle.net/gqozfb4L/

Baruch answered 26/6, 2019 at 9:43 Comment(0)

© 2022 - 2024 — McMap. All rights reserved.