JFreeChart PolarPlot: mathematical orientation
Asked Answered
C

3

1

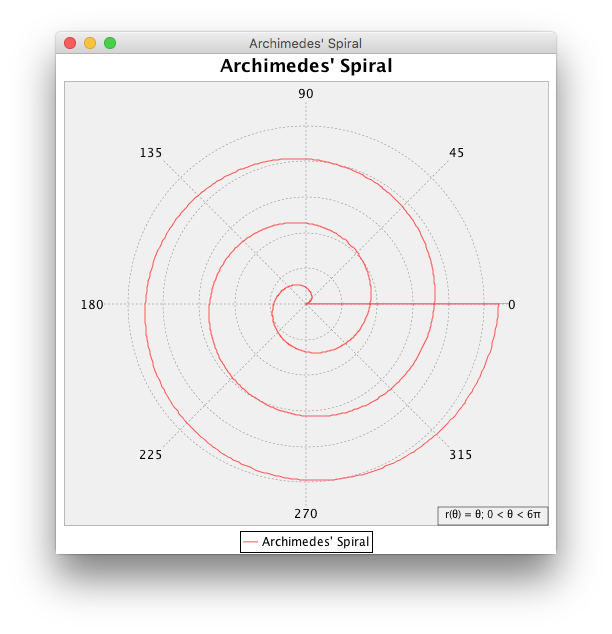
I'd like to create a polar plot where the data is plotted in mathematical orientation (thus, the series starts and the east and continues counter-clockwise). The default behavior of JFreeChart's PolarPlot is to start north and continue the series clockwise.

Is there any support for this built in the PolarPlot class? I know how to transform the data to reach the goal, but this approach is rather cumbersome, since I'd need to adapt the angle labeling too.

Craniometry answered 11/8, 2010 at 13:34 Comment(0)
G
5

As an aside, org.jfree.chart.plot.PolarPlot appears to have been designed for navigational and geodetic applications.

Using the transformation θ' = π/4 – θ and overriding refreshAngleTicks(), as suggested by @mort, produces reasonable results.

Addendum: See also this variation using the new PolarPlot API. The revised example below incorporates those changes and updates to Java 21, JFreeChart 1.5.5.

archimedes spiral

import java.awt.Color;
import java.awt.Dimension;
import java.awt.EventQueue;
import javax.swing.JFrame;
import org.jfree.chart.ChartPanel;
import org.jfree.chart.JFreeChart;
import org.jfree.chart.axis.NumberAxis;
import org.jfree.chart.plot.PolarAxisLocation;
import org.jfree.chart.plot.PolarPlot;
import org.jfree.chart.renderer.DefaultPolarItemRenderer;
import org.jfree.data.xy.XYDataset;
import org.jfree.data.xy.XYSeries;
import org.jfree.data.xy.XYSeriesCollection;

/**
 * @see https://en.wikipedia.org/wiki/Polar_coordinate_system
 * @see https://mcmap.net/q/541839/-jfreechart-polarplot-mathematical-orientation/230513
 * @see https://mcmap.net/q/541836/-jfreechart-polar-chart-shape-annotation
 * @see https://mcmap.net/q/541827/-jfreechart-loop-through-polar-chart-sectors
 * @see https://mcmap.net/q/541839/-jfreechart-polarplot-mathematical-orientation
 */
public class ArchimedesSpiral {

    private static final String TITLE = "Archimedes' Spiral";

    private static XYDataset createDataset() {
        var result = new XYSeriesCollection();
        var series = new XYSeries(TITLE);
        for (int t = 0; t <= 3 * 360; t++) {
            series.add(t, t);
        }
        result.addSeries(series);
        return result;
    }

    private static JFreeChart createChart(XYDataset dataset) {
        var radiusAxis = new NumberAxis();
        radiusAxis.setTickLabelsVisible(false);
        var renderer = new DefaultPolarItemRenderer();
        renderer.setShapesVisible(false);
        var plot = new PolarPlot(dataset, radiusAxis, renderer);
        plot.setCounterClockwise(true);
        plot.setAxisLocation(PolarAxisLocation.EAST_BELOW);
        plot.setAngleOffset(0);
        plot.setBackgroundPaint(new Color(0x00f0f0f0));
        plot.setRadiusGridlinePaint(Color.gray);
        plot.addCornerTextItem("r(θ) = θ; 0 < θ < 6π");
        var chart = new JFreeChart(
            TITLE, JFreeChart.DEFAULT_TITLE_FONT, plot, true);
        chart.setBackgroundPaint(Color.white);
        return chart;
    }

    public static void main(String[] args) {
        EventQueue.invokeLater(() -> {
            var frame = new JFrame(TITLE);
            var chart = createChart(createDataset());
            var panel = new ChartPanel(chart) {
                @Override
                public Dimension getPreferredSize() {
                    return new Dimension(500, 500);
                }
            };
            panel.setMouseZoomable(false);
            frame.add(panel);
            frame.setDefaultCloseOperation(JFrame.EXIT_ON_CLOSE);
            frame.pack();
            frame.setLocationRelativeTo(null);
            frame.setVisible(true);
        });
    }
}
Gleesome answered 12/8, 2010 at 11:58 Comment(0)
B
3

The current version of JFreeChart seems to solve this issue a lot easier: There are three methods available:

setCounterClockwise(true) // changes the direction of the ticks
setAxisLocation(PolarAxisLocation.EAST_BELOW) // defines the placement of the axis
setAngleOffset(0);

Complete example adapted from here:

import java.awt.Color;
import java.awt.Dimension;
import javax.swing.JFrame;
import org.jfree.chart.ChartPanel;
import org.jfree.chart.JFreeChart;
import org.jfree.chart.axis.NumberAxis;
import org.jfree.chart.axis.ValueAxis;
import org.jfree.chart.plot.PolarAxisLocation;
import org.jfree.chart.plot.PolarPlot;
import org.jfree.chart.renderer.DefaultPolarItemRenderer;
import org.jfree.data.xy.XYDataset;
import org.jfree.data.xy.XYSeries;
import org.jfree.data.xy.XYSeriesCollection;

/**
 * @see http://en.wikipedia.org/wiki/Polar_coordinate_system
 * @see https://stackoverflow.com/questions/3458824
 * @see https://stackoverflow.com/questions/6540390
 * @see https://stackoverflow.com/questions/6576911
 * @see https://mcmap.net/q/541839/-jfreechart-polarplot-mathematical-orientation
 */
public class ArchimedesSpiral extends JFrame {

    private static final String title = "Archimedes' Spiral";

    public ArchimedesSpiral(String title) {
        super(title);
        JFreeChart chart = createChart(createDataset());
        ChartPanel panel = new ChartPanel(chart);
        panel.setPreferredSize(new Dimension(500, 500));
        panel.setMouseZoomable(false);
        this.add(panel);
    }

    private static XYDataset createDataset() {
        XYSeriesCollection result = new XYSeriesCollection();
        XYSeries series = new XYSeries(title);
        for (int t = 0; t <= 3 * 360; t++) {
            series.add(t, t);
        }
        result.addSeries(series);
        return result;
    }

    private static JFreeChart createChart(XYDataset dataset) {
        ValueAxis radiusAxis = new NumberAxis();
        radiusAxis.setTickLabelsVisible(false);
        DefaultPolarItemRenderer renderer = new DefaultPolarItemRenderer();
        renderer.setShapesVisible(false);
        PolarPlot plot = new PolarPlot(dataset, radiusAxis, renderer);
        plot.setCounterClockwise(true);
        plot.setAxisLocation(PolarAxisLocation.EAST_BELOW);
        plot.setAngleOffset(0);
        plot.setBackgroundPaint(new Color(0x00f0f0f0));
        plot.setRadiusGridlinePaint(Color.gray);
        plot.addCornerTextItem("r(θ) = θ; 0 < θ < 6π");
        JFreeChart chart = new JFreeChart(
            title, JFreeChart.DEFAULT_TITLE_FONT, plot, true);
        chart.setBackgroundPaint(Color.white);
        return chart;
    }

    public static void main(String[] args) {
        ArchimedesSpiral demo = new ArchimedesSpiral(title);
        demo.setDefaultCloseOperation(JFrame.EXIT_ON_CLOSE);
        demo.pack();
        demo.setLocationRelativeTo(null);
        demo.setVisible(true);
    }
}
Brucine answered 19/4, 2012 at 11:43 Comment(1)
+1 for using the new API; mort: don't hesitate to accept this answer.Gleesome
C
2

Unfortunately, there seems to be no built-in support for this. The angle labeling can be adapted by overriding the refreshAngleTicks() methods of PolarPlot:

PolarPlot plot = new PolarPlot() {

        @Override
        protected List refreshAngleTicks() {
            List ticks = new ArrayList();
            // produce some ticks, e.g. NumberTick instances
            ticks.add(new NumberTick(0, "90", TextAnchor.TOP_LEFT, TextAnchor.TOP_LEFT, 0));
            ticks.add(new NumberTick(45, "45", TextAnchor.TOP_LEFT, TextAnchor.TOP_LEFT, 0));
            ticks.add(new NumberTick(90, "0", TextAnchor.TOP_LEFT, TextAnchor.TOP_LEFT, 0));
            ticks.add(new NumberTick(135, "315", TextAnchor.TOP_LEFT, TextAnchor.TOP_LEFT, 0));
            ticks.add(new NumberTick(180, "270", TextAnchor.TOP_LEFT, TextAnchor.TOP_LEFT, 0));
            ticks.add(new NumberTick(225, "225", TextAnchor.TOP_LEFT, TextAnchor.TOP_LEFT, 0));
            ticks.add(new NumberTick(270, "180", TextAnchor.TOP_LEFT, TextAnchor.TOP_LEFT, 0));
            ticks.add(new NumberTick(315, "135", TextAnchor.TOP_LEFT, TextAnchor.TOP_LEFT, 0));
            return ticks;
        }
    };
Craniometry answered 12/8, 2010 at 10:22 Comment(2)
I'd like to have a polar plot as it is used in mathematics or electronics...the data should be drawn starting east (at the right part of the x-axis) and be continued counter-clockwise. See en.wikipedia.org/wiki/Polar_coordinate_system for graph examples.Craniometry
+1 for refreshAngleTicks(). I meant transformation as in θ' = π/4 - θ.Gleesome

© 2022 - 2024 — McMap. All rights reserved.