ggplot legend showing transparency and fill color
Asked Answered
C

1

15

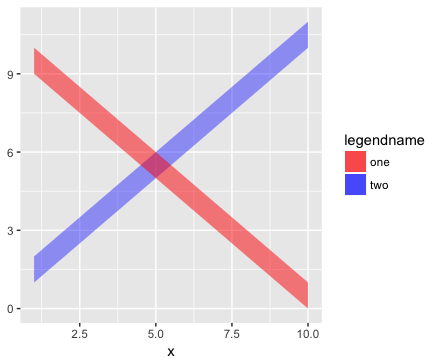
I'm plotting two semi-transparent ribbons together. Using the code below, without the scale_fill_manual portion, I get basically what I want, with a legend called "red", and labels blue and red. Adding the scale_fill_manual portion allows me to name the legend and its entries what I want, but i lose the transparency of the colored rectangles in the legend.

x=1:10
y1=1:10
y2=2:11
y3=10:1
y4=9:0
dt=data.frame(x,y1,y2,y3,y4)
library(ggplot2)    
ggplot(dt)+
  geom_ribbon(aes(x=x,ymin=y1,ymax=y2,fill='red'),
              alpha=0.4,)+
  geom_ribbon(aes(x=x,ymin=y3,ymax=y4,fill='blue'),
              alpha=0.5)+
  scale_fill_manual(name='legendname',
                    values=c('red','blue'),
                    labels=c('one','two'))

enter image description here

output of sessionInfo()

R version 2.15.2 (2012-10-26)
Platform: x86_64-apple-darwin9.8.0/x86_64 (64-bit)

locale:
[1] en_US.UTF-8/en_US.UTF-8/en_US.UTF-8/C/en_US.UTF-8/en_US.UTF-8

attached base packages:
[1] stats     graphics  grDevices utils     datasets  methods   base     

other attached packages:
[1] scales_0.2.3   ggplot2_0.9.3  plyr_1.8       reshape2_1.2.2

loaded via a namespace (and not attached):
 [1] colorspace_1.2-0   dichromat_1.2-4    digest_0.6.0       grid_2.15.2        gtable_0.1.2       labeling_0.1      
 [7] MASS_7.3-22        munsell_0.4        proto_0.3-10       RColorBrewer_1.0-5 rstudio_0.97.248   stringr_0.6.2     
[13] tools_2.15.2   

There are a lot of solutions to similar issues (Customize legend in ggplot, https://stats.stackexchange.com/questions/5007/how-can-i-change-the-title-of-a-legend-in-ggplot2, etc.), but I can't find anything that addresses this specifically.

Thanks in advance

Caret answered 2/1, 2013 at 23:34 Comment(0)
A
15

You can override the aesthetics in the legend by adding:

+ guides(fill = guide_legend(override.aes= list(alpha = 0.4)))

to your ggplot call.

But as with most things in ggplot, it is probably simpler to arrange your data in a way that makes the multiple geom_ribbon calls unnecessary:

dt1 <- data.frame(x = c(x,x),
                  ymin = c(y1,y3),
                  ymax = c(y2,y4),
                  grp = rep(c('red','blue'),each = 10))
ggplot(data = dt1,aes(x = x,ymin = ymin, ymax = ymax,fill = grp)) + 
    geom_ribbon(alpha = 0.4) + 
    scale_fill_manual(name = "legendname",
                      values = c('red','blue'),
                      labels = c('one','two'))

enter image description here

Aureomycin answered 2/1, 2013 at 23:54 Comment(10)
This solution works for me, as I only require 1 level of transparency [0.4]. Can you comment on how the solution would change if each ribbon had a unique transparency?Caret
@Caret alpha is an aesthetic that can itself be mapped to a variable just like any other. So you'd map alpha = grp and probably add a scale_alpha_manual component.Aureomycin
You first solution does not give the expected result. Is it a regression bug? Instead of alpha=0.4 you need something more like alpha=0.12 (exact adjustment unknown). Your second solution works.Rondo
@Rondo It still seems to work fine for me. (R 3.4.3, ggplot2 2.2.1, macOS). Overriding with alpha = 0.1 looks obviously too light, 0.9 is obviously too dark and 0.4 looks pretty darn close to the rest of the graph (for me).Aureomycin
Thanks Joran. Here's what I get: doesn't the legend look darker than the ribbon? i.sstatic.net/JhRVg.png. [I'm on R 3.4.4 + gg2.2.1 + MacOS]Rondo
@Rondo Kind of, but I find it hard to gauge alpha levels in isolation. When I run p + guides(fill = guide_legend(override.aes= list(alpha = 0.4))) repeatedly, shifting it slowly away from 0.4, it's obvious to me that anything below is too light and anything above is too dark.Aureomycin
Thanks Joran. This bugged me enough that I posted an issue (github.com/tidyverse/ggplot2/issues/2529). I still find the legend colors darker, though I agree with you it's not easy to judge!Rondo
@Rondo I think it may be an odd corner case arising from the (probably inadvisable) use of independent repeated geom_ribbon() layers. That's an unusual construction; "normal" uses with properly melted data works fine. I think that's why it appears sometimes but not others.Aureomycin
I'll try to work out how to properly melt the data for use with the geom_rect and geom_ribbon. I have found it tricky. Perhaps I'm missing something rather obvious. Thanks again joran!Rondo
Here is the explanation of the problem by Hadley: github.com/tidyverse/ggplot2/issues/2529Rondo

© 2022 - 2024 — McMap. All rights reserved.