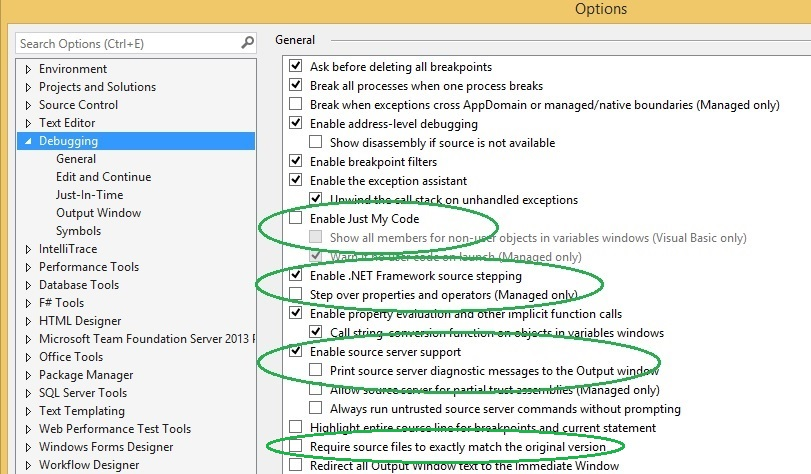
I am currently profiling a console application with CPU sampling. The OS is Windows 8 Enterprise 64 bit with Microsoft Visual Studio Ultimate 2012 Update 4. I see that the 34% of Exclusive Samples is inside the mscorlib.ni.dll. Then on the Modules view I open the mscorlib.ni.dll and I see that all calls are made to unknwon lines.
I downloaded them firstly with ngen following these instruction: http://blogs.msdn.com/b/visualstudioalm/archive/2012/12/10/creating-ngen-pdbs-for-profiling-reports.aspx but with no luck. Despite the presence of the pdb in the correct position and correctly referenced on the VS options.
After this I tried to get all possible symbols with this PS script: http://knagis.miga.lv/gen_ngen_pdb.txt but still no luck. Even if the pdb is (still) there.
Does someone has already had this issue? I have seen another answer Code profiling to improve performance : see CPU cycles inside mscorlib.dll? but does not resolve at all...
Enrico

