I have a panel containing three plots. How can I use par to specify the width and height of the main panel so it is always at a fixed size?
I usually set this at the start of my session with windows.options:
windows.options(width=10, height=10)

# plot away
plot(...)
If you need to reset to "factory settings":
dev.off()
windows.options(reset=TRUE)

# more plotting
plot(...)
Browse[1]> windows.options(width=10, height=10) Error in windows.options(width = 10, height = 10) : could not find function "windows.options" –
Racism You do that in the device, e.g.
x11(width=4, height=6)
and similarly for the file-based ones
pdf("/tmp/foo.pdf", width=4, height=6)
You can read the physical size via par("cin") etc but not set it.
width and height are specified in inch. –
Enosis Neither solution works in Jupyter notebooks. Here is a general approach that works in any environment:
options(repr.plot.width=6, repr.plot.height=4)
Just keep the following function handy:
set_plot_dimensions <- function(width_choice, height_choice) {
        options(repr.plot.width=width_choice, repr.plot.height=height_choice)
        }
EXAMPLE
Data
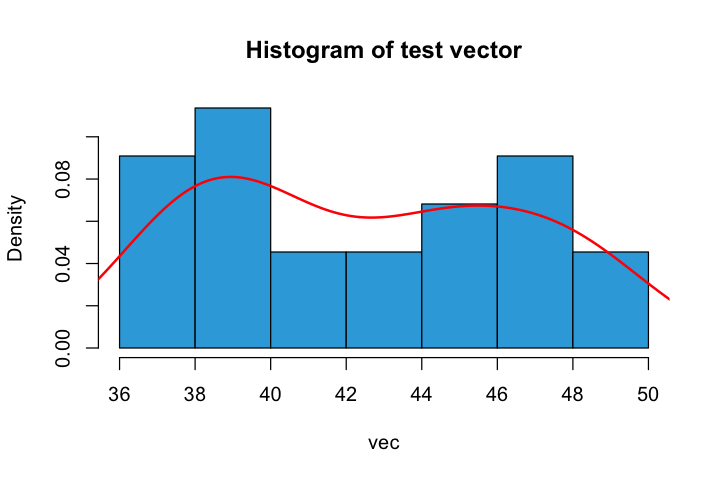
x <- c(37.50,46.79,48.30,46.04,43.40,39.25,38.49,49.51,40.38,36.98,40.00,38.49,37.74,47.92,44.53,44.91,44.91,40.00,41.51,47.92,36.98,43.40)
Call function with dimensions, and draw plot:
set_plot_dimensions(6, 4)
show_distribution(x, 'test vector')
set_plot_dimensions(16, 4)
show_distribution(x, 'test vector')
I usually set this at the start of my session with windows.options:
windows.options(width=10, height=10)

# plot away
plot(...)
If you need to reset to "factory settings":
dev.off()
windows.options(reset=TRUE)

# more plotting
plot(...)
Browse[1]> windows.options(width=10, height=10) Error in windows.options(width = 10, height = 10) : could not find function "windows.options" –
Racism I think a ggplot based answer is needed here...
If you want to save a figure as you have seen in the preview window, this would be the best practice:
- ggplot first
 ggplot(mtcars, aes(x=wt, y=mpg)) +
           geom_point(size=2, shape=23)
Check the figure in Rstudio Plots window, if not satisfied, click Zoom, drag the pop-out window to your preferred size
right click the figure and choose Inspect element
then you see the line
<img id="plot" width="100%" height="100%" src="plot_zoom_png?width=214&height=151">
The above line suggests that your best width is 2.14 and best height at 1.51
- ggsave() what you have just seen
ggsave(filename = "foo3.png",width = 2.14, height = 1.51, dpi = 300)
# set the dpi as journal requirement, now the dpi only changes image quality, not image content, default unit is 'in' inch
If you want to shape your figure to fit a journal's need, this would be the best practice:
Obtain parameters from the journal, for example width = 180mm, height =185mm following Nature Link
Create a new Figure window using that parameters
# you only need noRStudioGD=TRUE if using Rstudio
dev.new(width = 90, height = 180, unit = "mm",noRStudioGD=TRUE)
#note that a new window will appear in your task bar
plot() or ggplot() and preview the figure in that window
ggsave() what you have seen
ggsave(filename = "foo3.png",width = 90, height = 180, unit = "mm", dpi = 300)
© 2022 - 2025 — McMap. All rights reserved.


