Estimation of number of Clusters via gap statistics and prediction strength
Asked Answered
L

2

26

I am trying to translate the R implementations of gap statistics and prediction strength http://edchedch.wordpress.com/2011/03/19/counting-clusters/ into python scripts for the estimation of number of clusters in iris data with 3 clusters. Instead of getting 3 clusters, I get different results on different runs with 3 (actual number of clusters) hardly estimated. Graph shows estimated number to be 10 instead of 3. Am I missing something? Can anyone help me locate the problem?

import random
import numpy as np
import matplotlib.pyplot as plt
from sklearn.cluster import KMeans


def dispersion (data, k):
    if k == 1:
        cluster_mean = np.mean(data, axis=0)
        distances_from_mean = np.sum((data - cluster_mean)**2,axis=1)
        dispersion_val = np.log(sum(distances_from_mean))
    else:
        k_means_model_ = KMeans(n_clusters=k, max_iter=50, n_init=5).fit(data)
        distances_from_mean = range(k)
        for i in range(k):
            distances_from_mean[i] = int()
            for idx, label in enumerate(k_means_model_.labels_):
                if i == label:
                    distances_from_mean[i] += sum((data[idx] - k_means_model_.cluster_centers_[i])**2)
        dispersion_val = np.log(sum(distances_from_mean))

    return dispersion_val

def reference_dispersion(data, num_clusters, num_reference_bootstraps):
    dispersions = [dispersion(generate_uniform_points(data), num_clusters) for i in range(num_reference_bootstraps)]
    mean_dispersion = np.mean(dispersions)
    stddev_dispersion = float(np.std(dispersions)) / np.sqrt(1. + 1. / num_reference_bootstraps) 
    return mean_dispersion

def generate_uniform_points(data):
    mins = np.argmin(data, axis=0)
    maxs = np.argmax(data, axis=0)

    num_dimensions = data.shape[1]
    num_datapoints = data.shape[0]

    reference_data_set = np.zeros((num_datapoints,num_dimensions))
    for i in range(num_datapoints):
        for j in range(num_dimensions):
            reference_data_set[i][j] = random.uniform(data[mins[j]][j],data[maxs[j]][j])

    return reference_data_set   

def gap_statistic (data, nthCluster, referenceDatasets):
    actual_dispersion = dispersion(data, nthCluster)
    ref_dispersion = reference_dispersion(data, nthCluster, num_reference_bootstraps)
    return actual_dispersion, ref_dispersion

if __name__ == "__main__":

    data=np.loadtxt('iris.mat', delimiter=',', dtype=float)

    maxClusters = 10
    num_reference_bootstraps = 10
    dispersion_values = np.zeros((maxClusters,2))

    for cluster in range(1, maxClusters+1):
        dispersion_values_actual,dispersion_values_reference = gap_statistic(data, cluster, num_reference_bootstraps)
        dispersion_values[cluster-1][0] = dispersion_values_actual
        dispersion_values[cluster-1][1] = dispersion_values_reference

    gaps = dispersion_values[:,1] - dispersion_values[:,0]

    print gaps
    print "The estimated number of clusters is ", range(maxClusters)[np.argmax(gaps)]+1

    plt.plot(range(len(gaps)), gaps)
    plt.show()
Lowbred answered 8/1, 2014 at 17:39 Comment(5)
I even ran the r implementation of gaps statistics of my data. As I increase the maximum number of clusters, the estimated number of clusters increases as well.Lowbred
How did you get a result for 0 clusters?? Also, unfortunately, Iris data is real data, and a lot of such "research" was ever only validated on synthetic data sets; so I'm not surprised it doesn't work, actually.Kironde
0 is just an array index and stands for k=1. I have translated the prediction strength as well. That gives pretty good results on iris data. I guess there is some bug in the r implementation which I am unable to figure. How can estimated k be dependent on max number of clusters. When I tried max cluster = 20, it estimates k=19.Lowbred
you can refer to this: datasciencelab.wordpress.com/2013/12/27/… . Also, your stddev_dispersion isn't being used anywhere.Antihero
Have you sorted it out? The different predictions every time are due to the random_state parameter being None (which results in using np.random). If you want to get persistent results you should do something like KMeans(n_clusters=k, max_iter=50, n_init=5, random_state=1234)Darbydarce
H
1

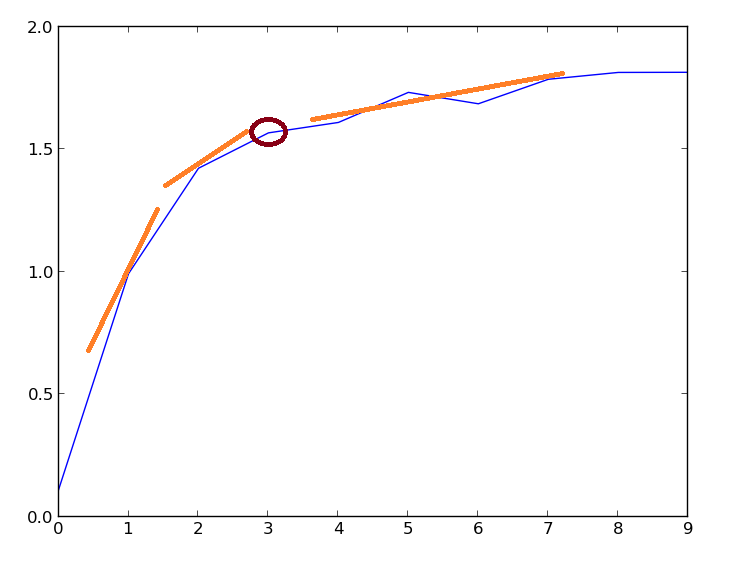
Your graph is showing the correct value of 3. Let me explain a bit

enter image description here

  • As you increase the number of clusters, your distance metric will certainly decrease. Therefore you are assuming that the correct value is 10. If you increase it to beyond 10, the distance metric will further decrease. But this should not be our decision making criteria
  • We need to find the inflection point ( here marked in RED ). It is the point where the slope smoothens out. You might want to take a look at elbow curves
  • Based on the above 2 points, the inflection point is 3 ( which is also the correct solution )

Hope this helps

Hibben answered 9/8, 2019 at 5:4 Comment(0)
G
0

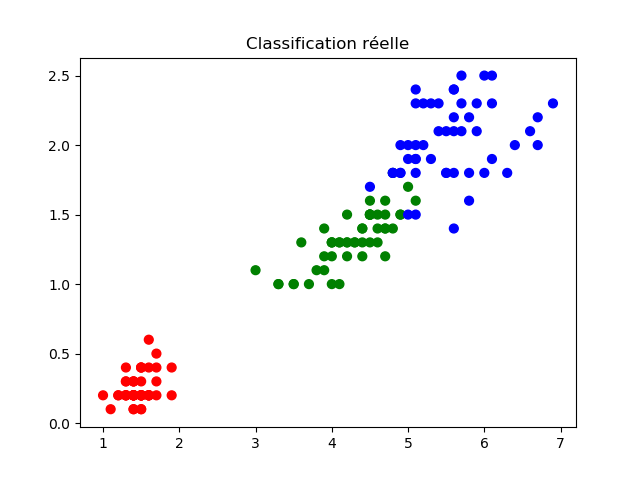
you could take a look on this code and you could change your output plot format

[![# coding: utf-8

# Implémentation de K-means clustering python


#Chargement des bibliothèques
import pandas as pd
import numpy as np
import matplotlib.pyplot as plt
from sklearn.cluster import KMeans
from sklearn import datasets


#chargement de jeu des données Iris
iris = datasets.load_iris()

#importer le jeu de données Iris dataset à l'aide du module pandas
x = pd.DataFrame(iris.data)

x.columns = \['Sepal_Length','Sepal_width','Petal_Length','Petal_width'\]


y = pd.DataFrame(iris.target)


y.columns = \['Targets'\]


#Création d'un objet K-Means avec un regroupement en 3 clusters (groupes)
model=KMeans(n_clusters=3)


#application du modèle sur notre jeu de données Iris
model.fit(x)


#Visualisation des clusters
plt.scatter(x.Petal_Length, x.Petal_width)
plt.show()


colormap=np.array(\['Red','green','blue'\])


#Visualisation du jeu de données sans altération de ce dernier (affichage des fleurs selon leur étiquettes)
plt.scatter(x.Petal_Length, x.Petal_width,c=colormap\[y.Targets\],s=40)
plt.title('Classification réelle')
plt.show()

#Visualisation des clusters formés par K-Means
plt.scatter(x.Petal_Length, x.Petal_width,c=colormap\[model.labels_\],s=40)
plt.title('Classification K-means ')
plt.show()][1]][1]

Output 1 Output 2

Gennagennaro answered 22/6, 2019 at 22:45 Comment(0)

© 2022 - 2024 — McMap. All rights reserved.