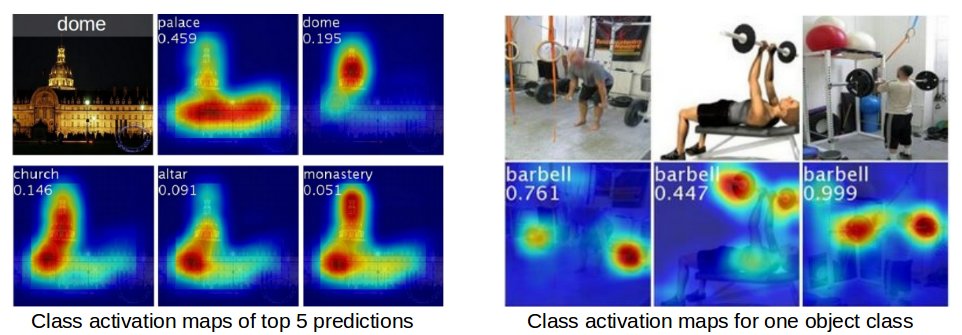
On the page you shared, it is done through a pre-trained model. You can use backbones like ResNet:
Load the backbone:
resnet_50 = tf.keras.applications.ResNet50(input_shape=(224, 224, 3),
                                           include_top=False,
                                           weights='imagenet')
Preprocess the image so that it matches resnet's default
img = cv2.imread("/content/your_image.jpg")[:,:,::-1]
img = cv2.resize(image, (224, 224))
ax = plt.imshow(img)

def preprocess(img):
  # use the pre processing function of ResNet50
  img = preprocess_input(img)

  #expand the dimension
  return np.expand_dims(img, 0)

input_image = preprocess(img)
Applying this paper's suggestions:
def postprocess_activations(activations):

  output = np.abs(activations)
  output = np.sum(output, axis = -1).squeeze()

  #resize and convert to image
  output = cv2.resize(output, (224, 224))
  output /= output.max()
  output *= 255
  return 255 - output.astype('uint8')
Generate and plot heatmaps:
def apply_heatmap(weights, img):

   #generate heat maps
   heatmap = cv2.applyColorMap(weights, cv2.COLORMAP_JET)
   heatmap = cv2.addWeighted(heatmap, 0.7, img, 0.3, 0)
return heatmap
Plot:
 def plot_heatmaps(rng):
  level_maps = None

  #given a range of indices generate the heat maps
  for i in rng:
    activations = get_activations_at(input_image, i)
    weights = postprocess_activations(activations)
    heatmap = apply_heatmap(weights, img)
    if level_maps is None:
      level_maps = heatmap
    else:
      level_maps = np.concatenate([level_maps, heatmap], axis = 1)
  plt.figure(figsize=(15, 15))
  plt.axis('off')
  ax = plt.imshow(level_maps)
plot_heatmaps(range(164, 169))


