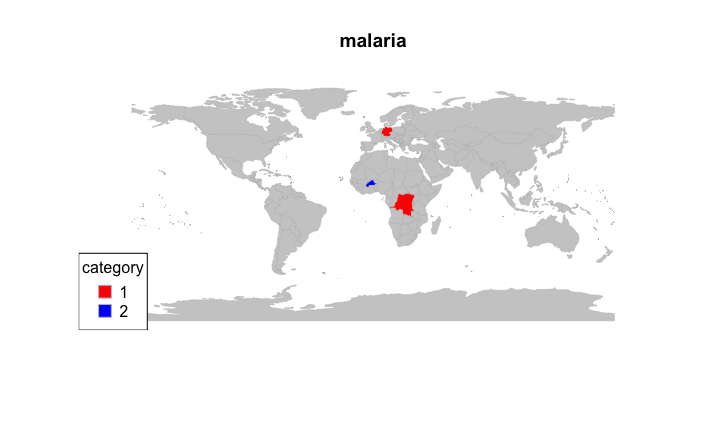
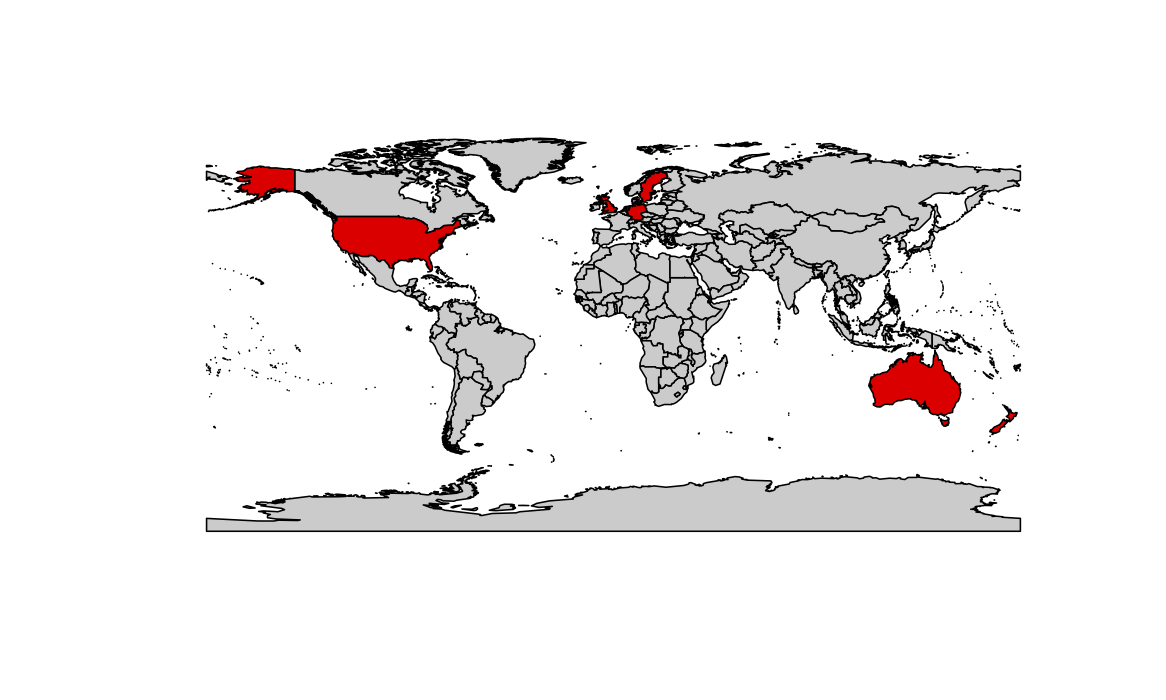
I would like to use R to generate a very basic world map with a specific set of countries filled with a red colour to indicate that they are malaria endemic countries.
I have a list of these countries in a data frame but am struggling to overlay them on a world map.
I have tried using the wrld_simpl object and also the joinCountryData2Map method in the rworldmap package.
I would comment on this answer to prevent addition of a possibly redundant question but I do not have enough reputation at the moment, apologies for this.
https://mcmap.net/q/536205/-using-r-maps-package-colouring-in-specific-nations-on-a-world-map
I am having difficulty understanding the arguments given to the plot() command - I wondered if there was just an easy way to tell R to plot all of the country NAMEs in my list on the wrld_simpl map instead of using grepl() etc. etc.
plot(wrld_simpl,
     col = c(gray(.80), "red")[grepl("^U", wrld_simpl@data$NAME) + 1])


