I have a database representing metadata of a security camera NVR. There's a 26-byte recording row for every 1-minute segment of video. (If you're curious, a design doc is in progress here.) My design limits are 8 cameras, 1 year (~4 million rows, half a million per camera). I've faked up some data to test performance. This query is slower than I expected:
select
  recording.start_time_90k,
  recording.duration_90k,
  recording.video_samples,
  recording.sample_file_bytes,
  recording.video_sample_entry_id
from
  recording
where
  camera_id = ?
order by
  recording.start_time_90k;
That's just scanning all data for a camera, using an index for filtering out other cameras and ordering. Index looks like this:
create index recording_camera_start on recording (camera_id, start_time_90k);
explain query plan looks as expected:
0|0|0|SEARCH TABLE recording USING INDEX recording_camera_start (camera_id=?)
The rows are quite small.
$ sqlite3_analyzer duplicated.db
...

*** Table RECORDING w/o any indices *******************************************

Percentage of total database......................  66.3%
Number of entries................................. 4225560
Bytes of storage consumed......................... 143418368
Bytes of payload.................................. 109333605   76.2%
B-tree depth...................................... 4
Average payload per entry......................... 25.87
Average unused bytes per entry.................... 0.99
Average fanout.................................... 94.00
Non-sequential pages.............................. 1            0.0%
Maximum payload per entry......................... 26
Entries that use overflow......................... 0            0.0%
Index pages used.................................. 1488
Primary pages used................................ 138569
Overflow pages used............................... 0
Total pages used.................................. 140057
Unused bytes on index pages....................... 188317      12.4%
Unused bytes on primary pages..................... 3987216      2.8%
Unused bytes on overflow pages.................... 0
Unused bytes on all pages......................... 4175533      2.9%

*** Index RECORDING_CAMERA_START of table RECORDING ***************************

Percentage of total database......................  33.7%
Number of entries................................. 4155718
Bytes of storage consumed......................... 73003008
Bytes of payload.................................. 58596767    80.3%
B-tree depth...................................... 4
Average payload per entry......................... 14.10
Average unused bytes per entry.................... 0.21
Average fanout.................................... 49.00
Non-sequential pages.............................. 1            0.001%
Maximum payload per entry......................... 14
Entries that use overflow......................... 0            0.0%
Index pages used.................................. 1449
Primary pages used................................ 69843
Overflow pages used............................... 0
Total pages used.................................. 71292
Unused bytes on index pages....................... 8463         0.57%
Unused bytes on primary pages..................... 865598       1.2%
Unused bytes on overflow pages.................... 0
Unused bytes on all pages......................... 874061       1.2%

...
I'd like something like this (maybe only a month at a time, rather than a full year) to be run every time a particular webpage is hit, so I want it to be quite fast. But on my laptop, it takes most of a second, and on the Raspberry Pi 2 I'd like to support, it's way too slow. Times (in seconds) below; it's CPU-bound (user+sys time ~= real time):
laptop$ time ./bench-profiled
trial 0: time 0.633 sec
trial 1: time 0.636 sec
trial 2: time 0.639 sec
trial 3: time 0.679 sec
trial 4: time 0.649 sec
trial 5: time 0.642 sec
trial 6: time 0.609 sec
trial 7: time 0.640 sec
trial 8: time 0.666 sec
trial 9: time 0.715 sec
...
PROFILE: interrupts/evictions/bytes = 1974/489/72648

real    0m20.546s
user    0m16.564s
sys     0m3.976s
(This is Ubuntu 15.10, SQLITE_VERSION says "3.8.11.1")

raspberrypi2$ time ./bench-profiled
trial 0: time 6.334 sec
trial 1: time 6.216 sec
trial 2: time 6.364 sec
trial 3: time 6.412 sec
trial 4: time 6.398 sec
trial 5: time 6.389 sec
trial 6: time 6.395 sec
trial 7: time 6.424 sec
trial 8: time 6.391 sec
trial 9: time 6.396 sec
...
PROFILE: interrupts/evictions/bytes = 19066/2585/43124

real    3m20.083s
user    2m47.120s
sys 0m30.620s
(This is Raspbian Jessie; SQLITE_VERSION says "3.8.7.1")
I'll likely end up doing some sort of denormalized data, but first I'd like to see if I can get this simple query to perform as well as it can. My benchmark's pretty simple; it prepares the statement in advance and then loops over this:
void Trial(sqlite3_stmt *stmt) {
  int ret;
  while ((ret = sqlite3_step(stmt)) == SQLITE_ROW) ;
  if (ret != SQLITE_DONE) {
    errx(1, "sqlite3_step: %d (%s)", ret, sqlite3_errstr(ret));
  }
  ret = sqlite3_reset(stmt);
  if (ret != SQLITE_OK) {
    errx(1, "sqlite3_reset: %d (%s)", ret, sqlite3_errstr(ret));
  }
}
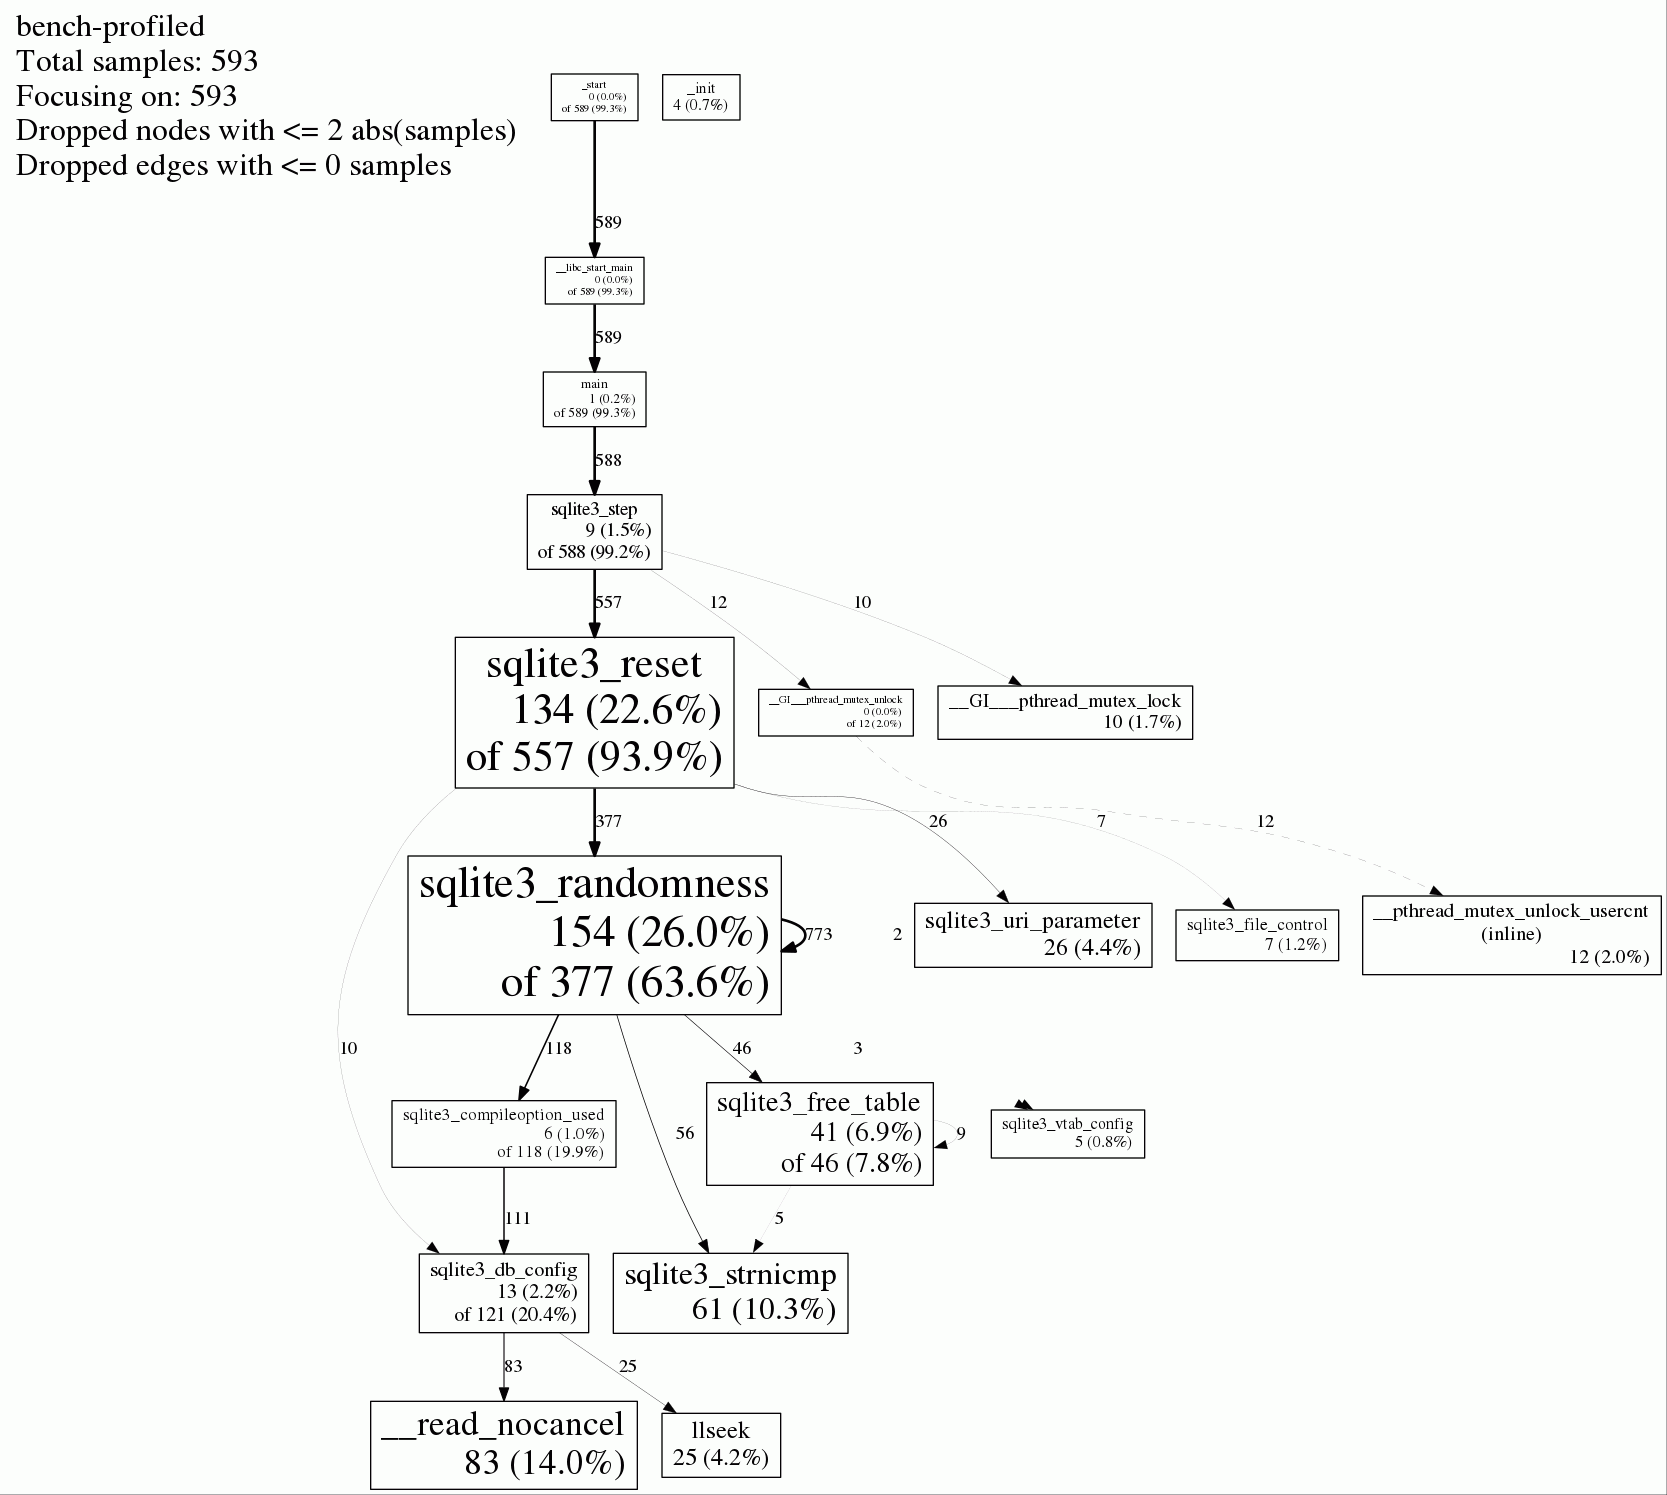
I made a CPU profile with gperftools. Image:
$ google-pprof bench-profiled timing.pprof
Using local file bench-profiled.
Using local file timing.pprof.
Welcome to pprof!  For help, type 'help'.
(pprof) top 10
Total: 593 samples
     154  26.0%  26.0%      377  63.6% sqlite3_randomness
     134  22.6%  48.6%      557  93.9% sqlite3_reset
      83  14.0%  62.6%       83  14.0% __read_nocancel
      61  10.3%  72.8%       61  10.3% sqlite3_strnicmp
      41   6.9%  79.8%       46   7.8% sqlite3_free_table
      26   4.4%  84.1%       26   4.4% sqlite3_uri_parameter
      25   4.2%  88.4%       25   4.2% llseek
      13   2.2%  90.6%      121  20.4% sqlite3_db_config
      12   2.0%  92.6%       12   2.0% __pthread_mutex_unlock_usercnt (inline)
      10   1.7%  94.3%       10   1.7% __GI___pthread_mutex_lock
This looks strange enough to give me hope it can be improved. Maybe I'm doing something dumb. I'm particularly skeptical of the sqlite3_randomness and sqlite3_strnicmp operations:
- docs say
sqlite3_randomnessis used for inserting rowids in some circumstances, but I'm just doing a select query. Why would it be using it now? From skimming sqlite3 source code, I see it's used in select forsqlite3ColumnsFromExprListbut that seems to be something that'd happen when preparing the statement. I'm doing that once, not in the part being benchmarked. strnicmpis for case-insensitive string comparisons. But every field in this table is an integer. Why would it be using this function? What is it comparing?- and in general, I don't know why
sqlite3_resetwould be expensive or why it'd be called fromsqlite3_step.
Schema:
-- Each row represents a single recorded segment of video.
-- Segments are typically ~60 seconds; never more than 5 minutes.
-- Each row should have a matching recording_detail row.
create table recording (
  id integer primary key,
  camera_id integer references camera (id) not null,

  sample_file_bytes integer not null check (sample_file_bytes > 0),

  -- The starting time of the recording, in 90 kHz units since
  -- 1970-01-01 00:00:00 UTC.
  start_time_90k integer not null check (start_time_90k >= 0),

  -- The duration of the recording, in 90 kHz units.
  duration_90k integer not null
      check (duration_90k >= 0 and duration_90k < 5*60*90000),

  video_samples integer not null check (video_samples > 0),
  video_sync_samples integer not null check (video_samples > 0),
  video_sample_entry_id integer references video_sample_entry (id)
);
I've tarred up my test data + test program; you can download it here.
Edit 1:
Ahh, looking through SQLite code, I see a clue:
int sqlite3_step(sqlite3_stmt *pStmt){
  int rc = SQLITE_OK;      /* Result from sqlite3Step() */
  int rc2 = SQLITE_OK;     /* Result from sqlite3Reprepare() */
  Vdbe *v = (Vdbe*)pStmt;  /* the prepared statement */
  int cnt = 0;             /* Counter to prevent infinite loop of reprepares */
  sqlite3 *db;             /* The database connection */

  if( vdbeSafetyNotNull(v) ){
    return SQLITE_MISUSE_BKPT;
  }
  db = v->db;
  sqlite3_mutex_enter(db->mutex);
  v->doingRerun = 0;
  while( (rc = sqlite3Step(v))==SQLITE_SCHEMA
         && cnt++ < SQLITE_MAX_SCHEMA_RETRY ){
    int savedPc = v->pc;
    rc2 = rc = sqlite3Reprepare(v);
    if( rc!=SQLITE_OK) break;
    sqlite3_reset(pStmt);
    if( savedPc>=0 ) v->doingRerun = 1;
    assert( v->expired==0 );
  }
It looks like sqlite3_step calls sqlite3_reset on schema change. (FAQ entry) I don't know why there'd be a schema change since my statement was prepared though...
Edit 2:
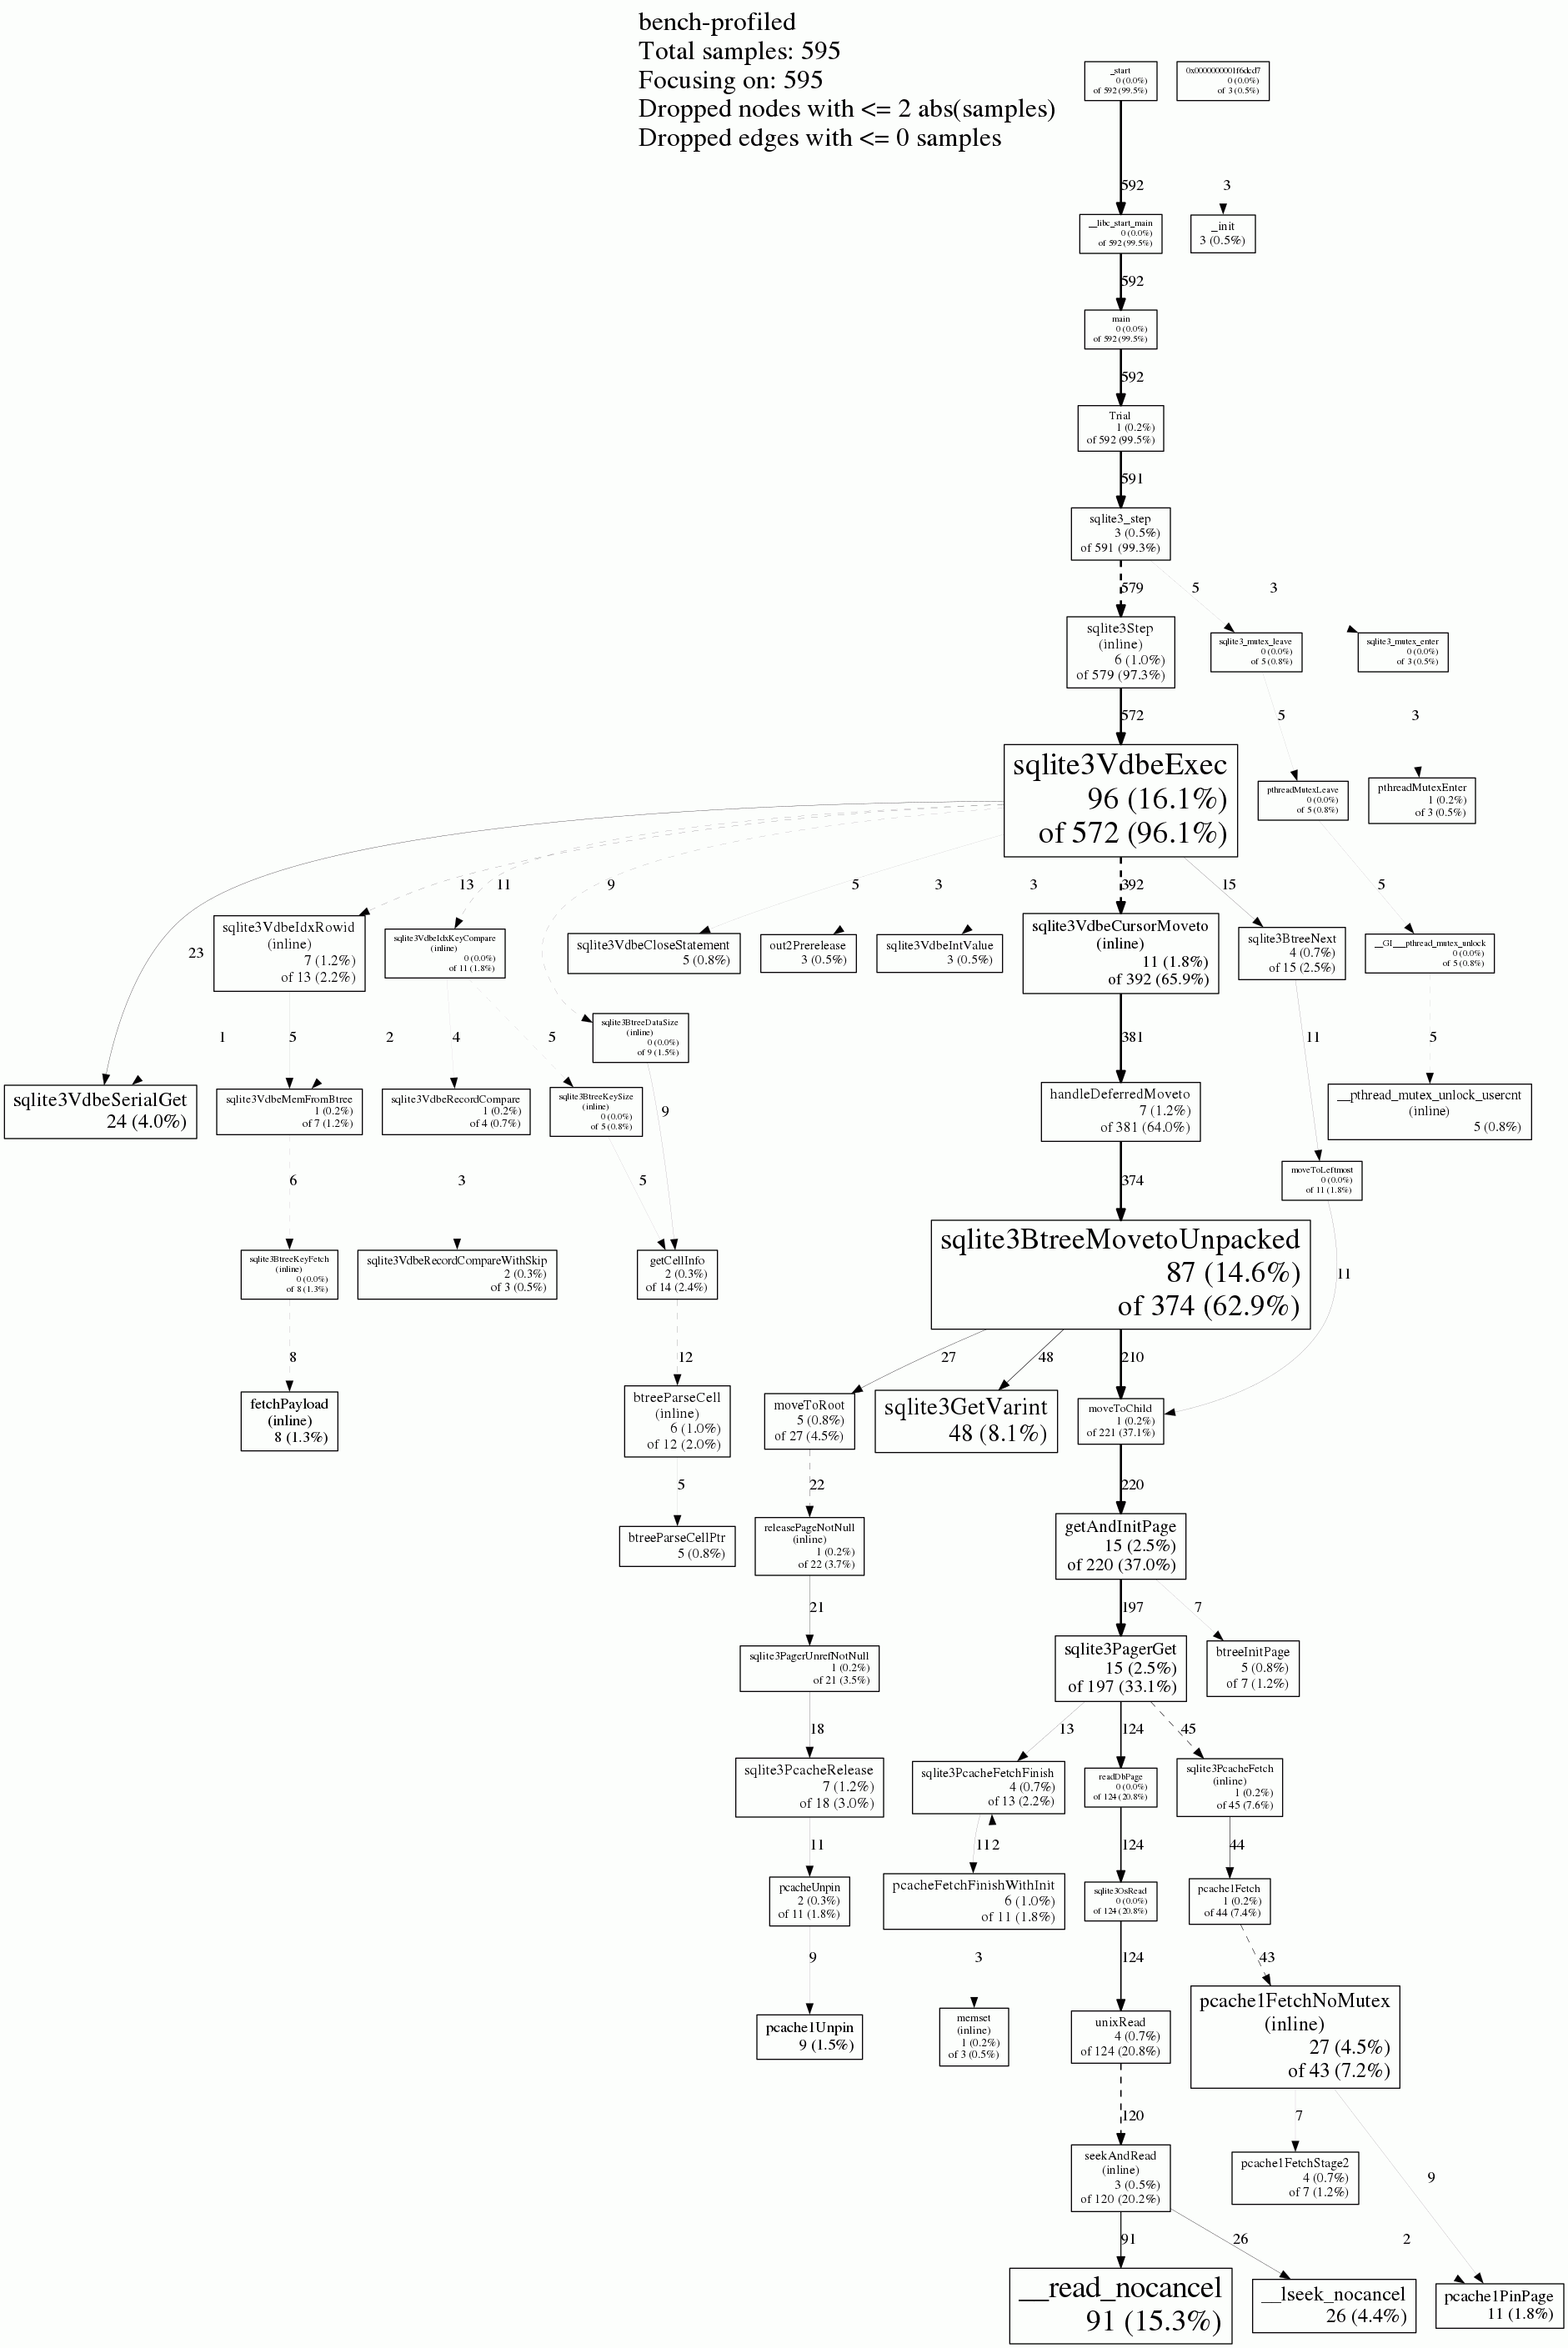
I downloaded the SQLite 3.10.1 "amalgation" and compiled against it with debugging symbols. I get a pretty different profile now that doesn't look as weird, but it's not any faster. Maybe the weird results I saw before were due to Identical Code Folding or something.
Edit 3:
Trying Ben's clustered index solution below, it is about 3.6X faster. I think this is the best I'm going to do with this query. SQLite's CPU performance is about ~700 MB/s on my laptop. Short of rewriting it to use a JIT compiler for its virtual machine or some such, I'm not going to do any better. In particular, I think the bizarre calls I saw on my first profile weren't actually happening; gcc must have written misleading debug info due to optimizations or something.
Even if the CPU performance would be improved, that throughput is more than my storage can do on cold read now, and I think the same is true on the Pi (which has a limited USB 2.0 bus for the SD card).
$ time ./bench
sqlite3 version: 3.10.1
trial 0: realtime 0.172 sec cputime 0.172 sec
trial 1: realtime 0.172 sec cputime 0.172 sec
trial 2: realtime 0.175 sec cputime 0.175 sec
trial 3: realtime 0.173 sec cputime 0.173 sec
trial 4: realtime 0.182 sec cputime 0.182 sec
trial 5: realtime 0.187 sec cputime 0.187 sec
trial 6: realtime 0.173 sec cputime 0.173 sec
trial 7: realtime 0.185 sec cputime 0.185 sec
trial 8: realtime 0.190 sec cputime 0.190 sec
trial 9: realtime 0.192 sec cputime 0.192 sec
trial 10: realtime 0.191 sec cputime 0.191 sec
trial 11: realtime 0.188 sec cputime 0.188 sec
trial 12: realtime 0.186 sec cputime 0.186 sec
trial 13: realtime 0.179 sec cputime 0.179 sec
trial 14: realtime 0.179 sec cputime 0.179 sec
trial 15: realtime 0.188 sec cputime 0.188 sec
trial 16: realtime 0.178 sec cputime 0.178 sec
trial 17: realtime 0.175 sec cputime 0.175 sec
trial 18: realtime 0.182 sec cputime 0.182 sec
trial 19: realtime 0.178 sec cputime 0.178 sec
trial 20: realtime 0.189 sec cputime 0.189 sec
trial 21: realtime 0.191 sec cputime 0.191 sec
trial 22: realtime 0.179 sec cputime 0.179 sec
trial 23: realtime 0.185 sec cputime 0.185 sec
trial 24: realtime 0.190 sec cputime 0.190 sec
trial 25: realtime 0.189 sec cputime 0.189 sec
trial 26: realtime 0.182 sec cputime 0.182 sec
trial 27: realtime 0.176 sec cputime 0.176 sec
trial 28: realtime 0.173 sec cputime 0.173 sec
trial 29: realtime 0.181 sec cputime 0.181 sec
PROFILE: interrupts/evictions/bytes = 547/178/24592

real    0m5.651s
user    0m5.292s
sys     0m0.356s
I may have to keep some denormalized data. Fortunately, I'm thinking I can just keep it in my application's RAM given that it won't be too big, startup doesn't have to be amazingly fast, and only the one process ever writes to the database.


dd, which just reads the bytes without interpreting. The wall clock time is actually similar (so I guess I won't actually improve that) but the CPU time is essentially nothing. Something like LevelDB I think would have much lower CPU usage...but it doesn't give me ACID like SQLite does, so I think I'll stick with SQLite anyway. – Director