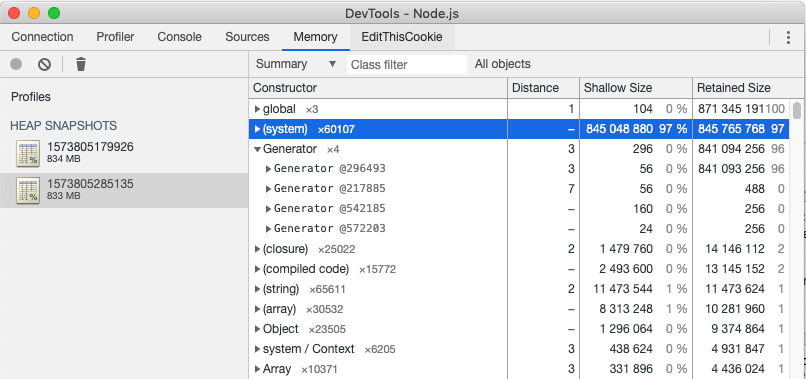
I am encountering a strange memory leak in our live-environment, where (system) objects in the heap keep growing.
Heap dump
Here is a memory dump where the memory usage grew to 800MB:

Notice that this memory is retained in a Generator object. TBH, I have no idea what that is.
Manually triggering garbage collection via global.gc(); usally frees about 10MB of memory. (But repetitive triggering of gc has no affect)
Application crashes
The application crashes roughly every 12 hours with following error:
2019-11-15T08:29:01.174417825Z 08:29:01 0|. | <--- Last few GCs --->
2019-11-15T08:29:01.176095829Z 08:29:01 0|. | [47:0x55ac8cdf3dc0] 65890519 ms: Scavenge 912.3 (929.2) -> 909.3 (929.2) MB, 6.7 / 0.0 ms  (average mu = 0.987, current mu = 0.987) allocation failure
2019-11-15T08:29:01.177260332Z 08:29:01 0|. | [47:0x55ac8cdf3dc0] 65890653 ms: Scavenge 912.9 (929.2) -> 910.0 (929.2) MB, 10.1 / 0.0 ms  (average mu = 0.987, current mu = 0.987) allocation failure
2019-11-15T08:29:01.178027234Z 08:29:01 0|. | [47:0x55ac8cdf3dc0] 65890701 ms: Scavenge 913.6 (929.2) -> 910.6 (929.2) MB, 6.3 / 0.0 ms  (average mu = 0.987, current mu = 0.987) allocation failure
2019-11-15T08:29:01.183406747Z 08:29:01 0|. | <--- JS stacktrace --->
2019-11-15T08:29:01.184194849Z 08:29:01 0|. | ==== JS stack trace =========================================
2019-11-15T08:29:01.184939851Z 08:29:01 0|. |     0: ExitFrame [pc: 0x55ac88379c39]
2019-11-15T08:29:01.185674553Z 08:29:01 0|. | Security context: 0x064ed4d408d1 <JSObject>
2019-11-15T08:29:01.187183757Z 08:29:01 0|. |     1: /* anonymous */ [0x34eb4a55a171] [/usr/src/app/node_modules/express-validator/src/chain/context-runner-impl.js:~25] [pc=0x34ab58ee2e1f](this=0x3c92e4142b89 <ContextRunnerImpl map = 0x13b2881d9399>)
2019-11-15T08:29:01.188904261Z 08:29:01 0|. |     2: next [0x64ed4d63621](this=0x34eb4a55a569 <JSGenerator>)
2019-11-15T08:29:01.190831866Z 08:29:01 0|. |     3: /* anonymous */(aka /* anonymous */) [0x34eb4a55a201] [/usr/src/app/node_modules/expr...
2019-11-15T08:29:01.195055876Z 08:29:01 0|. | FATAL ERROR: invalid array length Allocation failed - JavaScript heap out of memory
2019-11-15T08:29:01.396743877Z 2019-11-15T08:29:01: PM2 log: App [.:0] exited with code [0] via signal [SIGABRT]
2019-11-15T08:29:01.400481986Z 08:29:01 PM2      | App [.:0] exited with code [0] via signal [SIGABRT]
2019-11-15T08:29:01.403095193Z 2019-11-15T08:29:01: PM2 log: App [.:0] starting in -fork mode-
2019-11-15T08:29:01.406294501Z 08:29:01 PM2      | App [.:0] starting in -fork mode-
2019-11-15T08:29:01.419367433Z 2019-11-15T08:29:01: PM2 log: App [.:0] online
2019-11-15T08:29:01.422309441Z 08:29:01 PM2      | App [.:0] online

2019-11-15T08:29:03.279070252Z 08:29:03 0|.      | server started at http://localhost:80
Which happens around 1.2 GB process memory usage (at which point the machine is running on ~67% memory). This is strange on its own since i run the sever with the following command:
pm2 start . --no-daemon --node-args=\"--max-old-space-size=2048 --max-semi-space-size=4 --expose_gc\" --max-memory-restart 1536M
so node should have 2GB available and pm2 should restart well before the process reaches the limit.
Application background
The app is a json api written in TypeScript. It uses express to handle requests (about 3k per minute) and uses node-mssql to query an MS SQL Server.
Additionally it processes jobs (which perform additional sql queries) asynchronously via the bee-queue package.

es2017and watched the results, then usedes6then watched the results, what difference am I looking for? – Giron