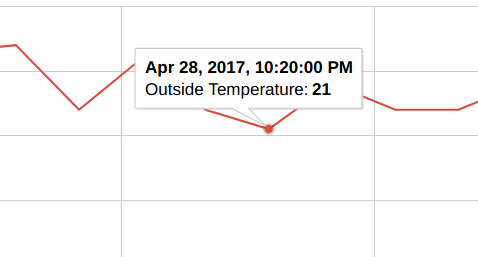
I am trying to set an option for a specific graph in the decimal form. I went through many questions, but I can't seem to figure out why it isn't working for me.
var temp_chart_options = {
   title: 'Temperature',
   hAxis: {title: 'Date',  titleTextStyle: {color: '#262626'}, format:'decimal' },
   vAxis: {minValue: 0, format: 'decimal'},
   keepInBounds: true,
};

temp_chart.draw(temp_data, temp_chart_options);
I tried doing format: 'decimal', or format: { pattern: 'decimal' } and even did temp_chart.draw(data, google.charts.Line.convertOptions(temp_chart_options)); and even looked at these questions:
- google chart vertical axis and tooltip value formatting
- Google Chart Vertical Axis and Tooltip Value Formatting
- How to format numbers in Google API Linechart?
But none of them seem to work :(
EDIT


