Colorize Clusters in Dendogram with ggplot2
Asked Answered
L

5

27

Didzis Elferts showed how to plot a dendogram using ggplot2 and ggdendro:

horizontal dendrogram in R with labels

here is the code:

labs = paste("sta_",1:50,sep="") #new labels
rownames(USArrests)<-labs #set new row names
hc <- hclust(dist(USArrests), "ave")

library(ggplot2)
library(ggdendro)

#convert cluster object to use with ggplot
dendr <- dendro_data(hc, type="rectangle") 

#your own labels are supplied in geom_text() and label=label
ggplot() + 
  geom_segment(data=segment(dendr), aes(x=x, y=y, xend=xend, yend=yend)) + 
  geom_text(data=label(dendr), aes(x=x, y=y, label=label, hjust=0), size=3) +
  coord_flip() + scale_y_reverse(expand=c(0.2, 0)) + 
  theme(axis.line.y=element_blank(),
        axis.ticks.y=element_blank(),
        axis.text.y=element_blank(),
        axis.title.y=element_blank(),
        panel.background=element_rect(fill="white"),
        panel.grid=element_blank())

Does anyone know, how to colorize the different clusters? For example, you want to have 2 Clusters (k=2) colorized?

Light answered 31/1, 2014 at 7:11 Comment(0)
S
19

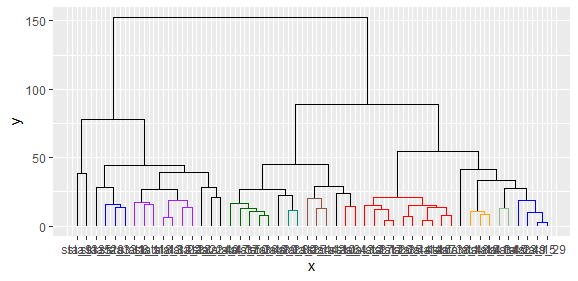
Workaround would be to plot cluster object with plot() and then use function rect.hclust() to draw borders around the clusters (nunber of clusters is set with argument k=). If result of rect.hclust() is saved as object it will make list of observation where each list element contains observations belonging to each cluster.

plot(hc)
gg<-rect.hclust(hc,k=2)

Now this list can be converted to dataframe where column clust contains names for clusters (in this example two groups) - names are repeated according to lengths of list elemets.

clust.gr<-data.frame(num=unlist(gg),
  clust=rep(c("Clust1","Clust2"),times=sapply(gg,length)))
head(clust.gr)
      num  clust
sta_1   1 Clust1
sta_2   2 Clust1
sta_3   3 Clust1
sta_5   5 Clust1
sta_8   8 Clust1
sta_9   9 Clust1

New data frame is merged with label() information of dendr object (dendro_data() result).

text.df<-merge(label(dendr),clust.gr,by.x="label",by.y="row.names")
head(text.df)
   label  x y num  clust
1  sta_1  8 0   1 Clust1
2 sta_10 28 0  10 Clust2
3 sta_11 41 0  11 Clust2
4 sta_12 31 0  12 Clust2
5 sta_13 10 0  13 Clust1
6 sta_14 37 0  14 Clust2

When plotting dendrogram use text.df to add labels with geom_text() and use column clust for colors.

ggplot() + 
  geom_segment(data=segment(dendr), aes(x=x, y=y, xend=xend, yend=yend)) + 
  geom_text(data=text.df, aes(x=x, y=y, label=label, hjust=0,color=clust), size=3) +
  coord_flip() + scale_y_reverse(expand=c(0.2, 0)) + 
  theme(axis.line.y=element_blank(),
        axis.ticks.y=element_blank(),
        axis.text.y=element_blank(),
        axis.title.y=element_blank(),
        panel.background=element_rect(fill="white"),
        panel.grid=element_blank())

enter image description here

Sollows answered 31/1, 2014 at 15:41 Comment(0)
T
27

This approach is very similar to @DidzisElferts', just a little simpler.

df   <- USArrests                 # really bad idea to muck up internal datasets
labs <- paste("sta_",1:50,sep="") # new labels
rownames(df) <- labs              # set new row names

library(ggplot2)
library(ggdendro)
hc       <- hclust(dist(df), "ave")           # heirarchal clustering
dendr    <- dendro_data(hc, type="rectangle") # convert for ggplot
clust    <- cutree(hc,k=2)                    # find 2 clusters
clust.df <- data.frame(label=names(clust), cluster=factor(clust))
# dendr[["labels"]] has the labels, merge with clust.df based on label column
dendr[["labels"]] <- merge(dendr[["labels"]],clust.df, by="label")
# plot the dendrogram; note use of color=cluster in geom_text(...)
ggplot() + 
  geom_segment(data=segment(dendr), aes(x=x, y=y, xend=xend, yend=yend)) + 
  geom_text(data=label(dendr), aes(x, y, label=label, hjust=0, color=cluster), 
           size=3) +
  coord_flip() + scale_y_reverse(expand=c(0.2, 0)) + 
  theme(axis.line.y=element_blank(),
        axis.ticks.y=element_blank(),
        axis.text.y=element_blank(),
        axis.title.y=element_blank(),
        panel.background=element_rect(fill="white"),
        panel.grid=element_blank())

Tinware answered 31/1, 2014 at 18:4 Comment(1)
+1 I new that there was another function to cut dendrogram but forgot about cutree :)Sollows
S
19

Workaround would be to plot cluster object with plot() and then use function rect.hclust() to draw borders around the clusters (nunber of clusters is set with argument k=). If result of rect.hclust() is saved as object it will make list of observation where each list element contains observations belonging to each cluster.

plot(hc)
gg<-rect.hclust(hc,k=2)

Now this list can be converted to dataframe where column clust contains names for clusters (in this example two groups) - names are repeated according to lengths of list elemets.

clust.gr<-data.frame(num=unlist(gg),
  clust=rep(c("Clust1","Clust2"),times=sapply(gg,length)))
head(clust.gr)
      num  clust
sta_1   1 Clust1
sta_2   2 Clust1
sta_3   3 Clust1
sta_5   5 Clust1
sta_8   8 Clust1
sta_9   9 Clust1

New data frame is merged with label() information of dendr object (dendro_data() result).

text.df<-merge(label(dendr),clust.gr,by.x="label",by.y="row.names")
head(text.df)
   label  x y num  clust
1  sta_1  8 0   1 Clust1
2 sta_10 28 0  10 Clust2
3 sta_11 41 0  11 Clust2
4 sta_12 31 0  12 Clust2
5 sta_13 10 0  13 Clust1
6 sta_14 37 0  14 Clust2

When plotting dendrogram use text.df to add labels with geom_text() and use column clust for colors.

ggplot() + 
  geom_segment(data=segment(dendr), aes(x=x, y=y, xend=xend, yend=yend)) + 
  geom_text(data=text.df, aes(x=x, y=y, label=label, hjust=0,color=clust), size=3) +
  coord_flip() + scale_y_reverse(expand=c(0.2, 0)) + 
  theme(axis.line.y=element_blank(),
        axis.ticks.y=element_blank(),
        axis.text.y=element_blank(),
        axis.title.y=element_blank(),
        panel.background=element_rect(fill="white"),
        panel.grid=element_blank())

enter image description here

Sollows answered 31/1, 2014 at 15:41 Comment(0)
F
14

Adding to @DidzisElferts' and @jlhoward's code, the dendrogram itself can be coloured.

library(ggplot2)
library(ggdendro)
library(plyr)
library(zoo)

df <- USArrests                       # really bad idea to muck up internal datasets
labs <- paste("sta_", 1:50, sep = "") # new labels
rownames(df) <- labs                  # set new row names

cut <- 4    # Number of clusters
hc <- hclust(dist(df), "ave")              # hierarchical clustering
dendr <- dendro_data(hc, type = "rectangle") 
clust <- cutree(hc, k = cut)               # find 'cut' clusters
clust.df <- data.frame(label = names(clust), cluster = clust)

# Split dendrogram into upper grey section and lower coloured section
height <- unique(dendr$segments$y)[order(unique(dendr$segments$y), decreasing = TRUE)]
cut.height <- mean(c(height[cut], height[cut-1]))
dendr$segments$line <- ifelse(dendr$segments$y == dendr$segments$yend &
   dendr$segments$y > cut.height, 1, 2)
dendr$segments$line <- ifelse(dendr$segments$yend  > cut.height, 1, dendr$segments$line)

# Number the clusters
dendr$segments$cluster <- c(-1, diff(dendr$segments$line))
change <- which(dendr$segments$cluster == 1)
for (i in 1:cut) dendr$segments$cluster[change[i]] = i + 1
dendr$segments$cluster <-  ifelse(dendr$segments$line == 1, 1, 
             ifelse(dendr$segments$cluster == 0, NA, dendr$segments$cluster))
dendr$segments$cluster <- na.locf(dendr$segments$cluster) 

# Consistent numbering between segment$cluster and label$cluster
clust.df$label <- factor(clust.df$label, levels = levels(dendr$labels$label))
clust.df <- arrange(clust.df, label)
clust.df$cluster <- factor((clust.df$cluster), levels = unique(clust.df$cluster), labels = (1:cut) + 1)
dendr[["labels"]] <- merge(dendr[["labels"]], clust.df, by = "label")

# Positions for cluster labels
n.rle <- rle(dendr$segments$cluster)
N <- cumsum(n.rle$lengths)
N <- N[seq(1, length(N), 2)] + 1
N.df <- dendr$segments[N, ]
N.df$cluster <- N.df$cluster - 1

# Plot the dendrogram
ggplot() + 
   geom_segment(data = segment(dendr), 
      aes(x=x, y=y, xend=xend, yend=yend, size=factor(line), colour=factor(cluster)), 
      lineend = "square", show.legend = FALSE) + 
   scale_colour_manual(values = c("grey60", rainbow(cut))) +
   scale_size_manual(values = c(.1, 1)) +
   geom_text(data = N.df, aes(x = x, y = y, label = factor(cluster),  colour = factor(cluster + 1)), 
      hjust = 1.5, show.legend = FALSE) +
   geom_text(data = label(dendr), aes(x, y, label = label, colour = factor(cluster)), 
       hjust = -0.2, size = 3, show.legend = FALSE) +
   scale_y_reverse(expand = c(0.2, 0)) + 
   labs(x = NULL, y = NULL) +
   coord_flip() +
    theme(axis.line.y = element_blank(),
        axis.ticks.y = element_blank(),
        axis.text.y = element_blank(),
        axis.title.y = element_blank(),
        panel.background = element_rect(fill = "white"),
        panel.grid = element_blank())

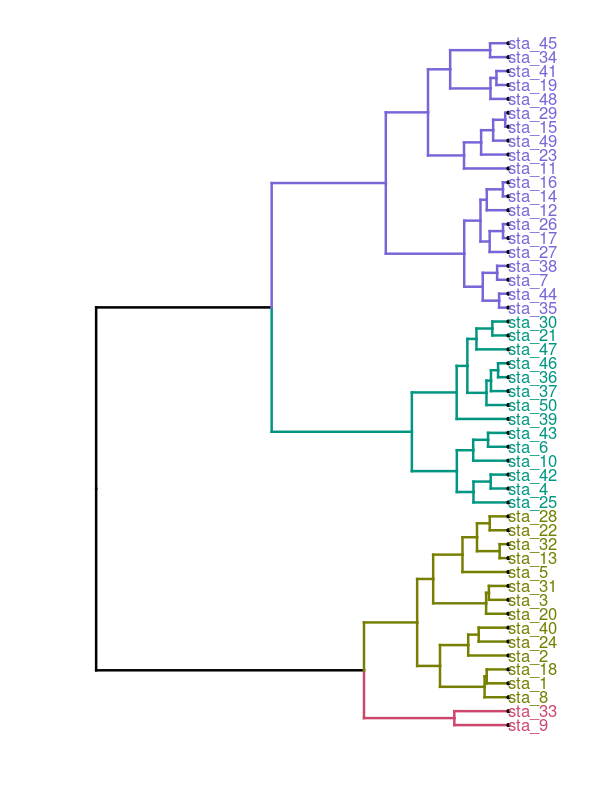
The 2-cluster and 4-cluster solutions: enter image description here

Forte answered 1/2, 2014 at 7:11 Comment(8)
Muito Muito Bom! Obrigado.Mangrum
Ao utilizar o método "ward.D" em hclust() tive problemas com as etiquetas dos grupos gráfico. Não consegui resolver. Tens alguma dica para isto?Mangrum
O que citei acima acontece também com o "ave". A etiqueta do Cluster em clust.df não necessariamente é igual a produzida no gráfico!!!Mangrum
@Mangrum I think I understand, but I cannot reply in Portuguese. I will look into your problem a little later. In the meantime, you might want to compare these responses with what the dendextend package can do.Forte
Ta bem. Vou examinar o pacote. Tenho um trabalho pra entregar e acabei utilizando os retângulos básicos para demostrar os grupos. Para o momento está de bom. Lhe questionei por puro interesse no modelo do gráfico. Ficou muito didático (Parabéns!) . Caso encontre uma solução ou tenha uma dica, vou utilizar em outros trabalhos. Obrigado pelo retorno.Mangrum
@Mangrum If I understand correctly: The labels for the clusters in the chart are not connected to any labels in cluster.df; the cluster labels in the chart are taken from N.df. The cluster labels in the chart are somewhat arbitrary; the only constraint is that the order in N.df is from bottom to top in the chart. The labels could be changed by adding a new label variable to N.df. Something like N.df$NEWcluster <- LETTERS[1:cut]. Then in the first geom_text line in the ggplot, change label = factor(cluster) to label = factor(NEWcluster).Forte
Apart from the colouring and the rotation, you can check that the ggplot dendrogram is the same as the hclust dendrogram, by plot(hc).Forte
Obrigado, vou verificar!Mangrum
V
7

A short way to achieve a similar result is to use the package dendextend, taken from this overview.

df   <- USArrests   # really bad idea to muck up internal datasets
labs <- paste("sta_",1:50,sep="") # new labels
rownames(df) <- labs # set new row names

require(magrittr)
require(ggplot2)
require(dendextend)

dend <- df %>% dist %>%
  hclust %>% as.dendrogram %>%
  set("branches_k_color", k = 4) %>% set("branches_lwd", 0.7) %>%
  set("labels_cex", 0.6) %>% set("labels_colors", k = 4) %>%
  set("leaves_pch", 19) %>% set("leaves_cex", 0.5) 
ggd1 <- as.ggdend(dend)
ggplot(ggd1, horiz = TRUE)

Note: The order of the states is slightly different compared to those above - not really changing interpretation though.

enter image description here

Vivia answered 18/1, 2017 at 15:56 Comment(2)
In this approach, how can we specify hclust(dist(df,method="euclidean"),method="ward.D2")?Recurved
stackoverflow.com/users/4057186/w-r ...df %>% dist(method="euclidean") %>% hclust(method="ward.D2") %>%... Just skip the first argument in each function because it is the thing you piped to itPtolemaeus
B
0

For those that are still looking for a convenient way to do this, you can use my package ggdendroplot (https://github.com/NicolasH2/ggdendroplot).

If you have the data from the posted example:

labs = paste("sta_",1:50,sep="") #new labels
rownames(USArrests)<-labs #set new row names
hc <- hclust(dist(USArrests), "ave")

...you can use ggdendroplot with ggplot to get a colored dendrogram:

devtools::install_github("NicolasH2/ggdendroplot")

library(ggdendroplot)
library(ggplot2)
ggplot() + geom_dendro(hc, dendrocut = 30)

You can turn it sideways and on its head etc. Its basically just a ggplot layer, so you can modify the graph further as you wish and add it to other ggplots. Check out the github page to see what you can do with ggdendroplot.

enter image description here

Bolan answered 6/3, 2021 at 21:4 Comment(0)

© 2022 - 2024 — McMap. All rights reserved.