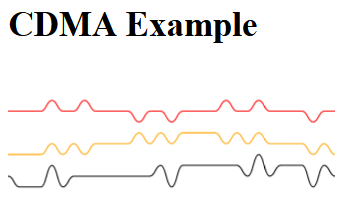
Here's a CDMA illustration where I've used cubic splines for illustrating CDMA concepts. First define these functions:
<script>
function go(x,y) {return(`M ${x},${y}`)}
function to(y) {return(`c 5 0 5 ${y} 10 ${y}`)}
function dn(y=10) {return to(y)}
function up(y=10) {return to(-y)}
function path(d,color='black') {return `<path d="${d}" stroke=${color} fill="none"/>`}
function svg(t) {return `<svg>${t}</svg>`}
function bits(n) {
  let s='', n0=(n>>1)
  for (m=0x80;m;m>>=1) s+= up(10* (!(m&n0)-!(m&n))  )
  return s;
}
function plot(a) {
  let s='', y0=0
  for (let y of a) {
    s += up(y-y0); y0=y
  }
  return s
}
function add(a) {
  let s=''
  if typeof y0 == 'undefined' var y0=0
  for (m=0x80;m;m>>=1) {
    let y=0; for (let e of a) y+= 5-10*!(e&m)
    s += up(y-y0); y0=y
  }
  return s
}
</script>
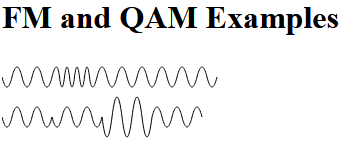
Then you can roughly illustrate waves like this:
<script>
  document.write(svg(path(go(0,25)+(up()+dn()).repeat(10))))
</script>
![Simple cosine-line wave for illustrative purposes]()
Here's an illustration of CDMA using this technique
<h1>CDMA Example</h1>
<script>
a=0b00010010
b=0b00010101
document.write(svg(
  path(go(0,40)+bits(a)+bits(~a)+bits(a)+bits(~a)+bits(a),'red')+
  path(go(0,80)+bits(b)+bits(b)+bits(~b)+bits(~b)+bits(~b),'orange')+
  path(go(0,100+add([a,b])+add([~a,b])+add([a,~b])+add([~a,~b])+add([a,b])+add([~a,~b])))
))
</script>
![Multiplexing two signals using CDMA style technique (simplified)]()
NOTE: actual CDMA signals would not be bit-aligned or even chip-aligned


<path>element in the document – Forgotten