Avoid plotting missing values on a line plot
Asked Answered
P

6

28

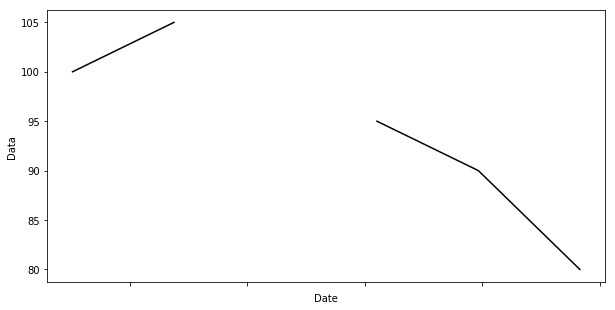
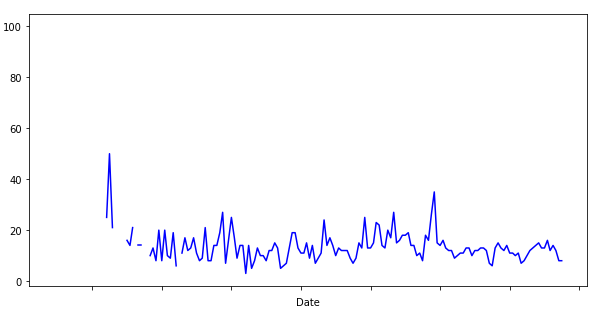
I want a line plot to indicate if a piece of data is missing such as: enter image description here
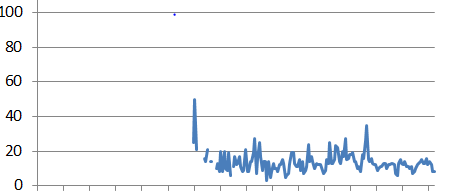
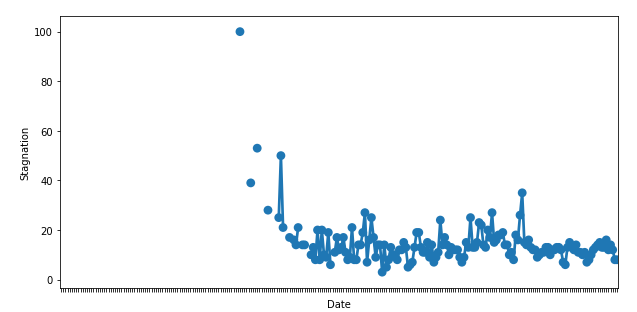
However, the code below fills the missing data, creating a potentially misleading chart: enter image description here

import pandas as pd
import seaborn as sns
from matplotlib import pyplot as plt

# load csv
df=pd.read_csv('data.csv')
# plot a graph
g = sns.lineplot(x="Date", y="Data", data=df)
plt.show()

What should I change in my code to avoid filling missing values?

csv looks as following:

Date,Stagnation
01-07-03,
01-08-03,
01-09-03,
01-10-03,
01-11-03,
01-12-03,100
01-01-04,
01-02-04,
01-03-04,
01-04-04,
01-05-04,39
01-06-04,
01-07-04,
01-08-04,53
01-09-04,
01-10-04,
01-11-04,
01-12-04,
01-01-05,28
01-02-05,
01-03-05,
01-04-05,
01-05-05,
01-06-05,25
01-07-05,50
01-08-05,21
01-09-05,
01-10-05,
01-11-05,17
01-12-05,
01-01-06,16
01-02-06,14
01-03-06,21
01-04-06,
01-05-06,14
01-06-06,14
01-07-06,
01-08-06,
01-09-06,10
01-10-06,13
01-11-06,8
01-12-06,20
01-01-07,8
01-02-07,20
01-03-07,10
01-04-07,9
01-05-07,19
01-06-07,6
01-07-07,
01-08-07,11
01-09-07,17
01-10-07,12
01-11-07,13
01-12-07,17
01-01-08,11
01-02-08,8
01-03-08,9
01-04-08,21
01-05-08,8
01-06-08,8
01-07-08,14
01-08-08,14
01-09-08,19
01-10-08,27
01-11-08,7
01-12-08,16
01-01-09,25
01-02-09,17
01-03-09,9
01-04-09,14
01-05-09,14
01-06-09,3
01-07-09,14
01-08-09,5
01-09-09,8
01-10-09,13
01-11-09,10
01-12-09,10
01-01-10,8
01-02-10,12
01-03-10,12
01-04-10,15
01-05-10,13
01-06-10,5
01-07-10,6
01-08-10,7
01-09-10,13
01-10-10,19
01-11-10,19
01-12-10,13
01-01-11,11
01-02-11,11
01-03-11,15
01-04-11,9
01-05-11,14
01-06-11,7
01-07-11,9
01-08-11,11
01-09-11,24
01-10-11,14
01-11-11,17
01-12-11,14
01-01-12,10
01-02-12,13
01-03-12,12
01-04-12,12
01-05-12,12
01-06-12,9
01-07-12,7
01-08-12,9
01-09-12,15
01-10-12,13
01-11-12,25
01-12-12,13
01-01-13,13
01-02-13,15
01-03-13,23
01-04-13,22
01-05-13,14
01-06-13,13
01-07-13,20
01-08-13,17
01-09-13,27
01-10-13,15
01-11-13,16
01-12-13,18
01-01-14,18
01-02-14,19
01-03-14,14
01-04-14,14
01-05-14,10
01-06-14,11
01-07-14,8
01-08-14,18
01-09-14,16
01-10-14,26
01-11-14,35
01-12-14,15
01-01-15,14
01-02-15,16
01-03-15,13
01-04-15,12
01-05-15,12
01-06-15,9
01-07-15,10
01-08-15,11
01-09-15,11
01-10-15,13
01-11-15,13
01-12-15,10
01-01-16,12
01-02-16,12
01-03-16,13
01-04-16,13
01-05-16,12
01-06-16,7
01-07-16,6
01-08-16,13
01-09-16,15
01-10-16,13
01-11-16,12
01-12-16,14
01-01-17,11
01-02-17,11
01-03-17,10
01-04-17,11
01-05-17,7
01-06-17,8
01-07-17,10
01-08-17,12
01-09-17,13
01-10-17,14
01-11-17,15
01-12-17,13
01-01-18,13
01-02-18,16
01-03-18,12
01-04-18,14
01-05-18,12
01-06-18,8
01-07-18,8
Pascale answered 30/8, 2018 at 13:40 Comment(0)
E
1
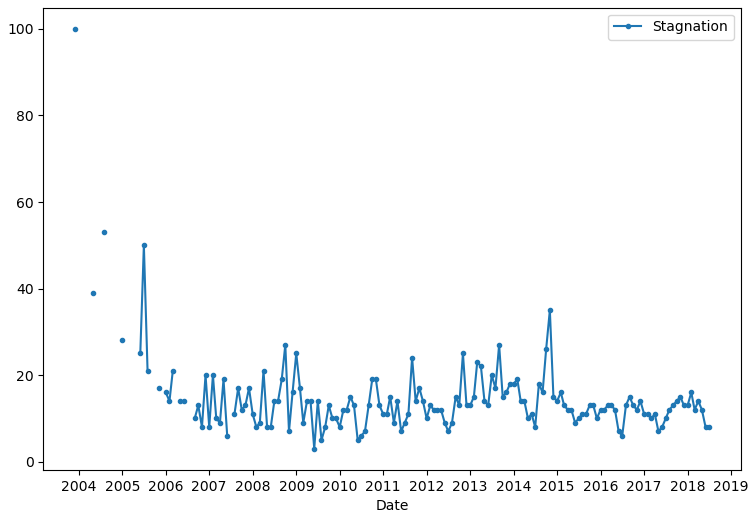
  • Since the data is already in a pandas.DataFrame, the easiest solution is to plot directly with pandas.DataFrame.plot, which uses matplotlib as the default plotting backend.
    • Incidentally, seaborn is a high-level API for matplotlib.
  • Tested in python 3.11.2, pandas 2.0.0, matplotlib 3.7.1
import pandas as pd
import matplotlib.pyplot as plt
import matplotlib.dates as mdates

# load the csv file
df = pd.read_csv('d:/data/hh.ru_stack.csv')

# convert the date column to a datetime.date
df.Date = pd.to_datetime(df.Date, format='%d-%m-%y').dt.date

# plot with markers
ax = df.plot(x='Date', marker='.', figsize=(9, 6))

# set the ticks for every year if desired
ax.xaxis.set_major_locator(mdates.YearLocator())
ax.xaxis.set_major_formatter(mdates.DateFormatter("%Y"))

enter image description here

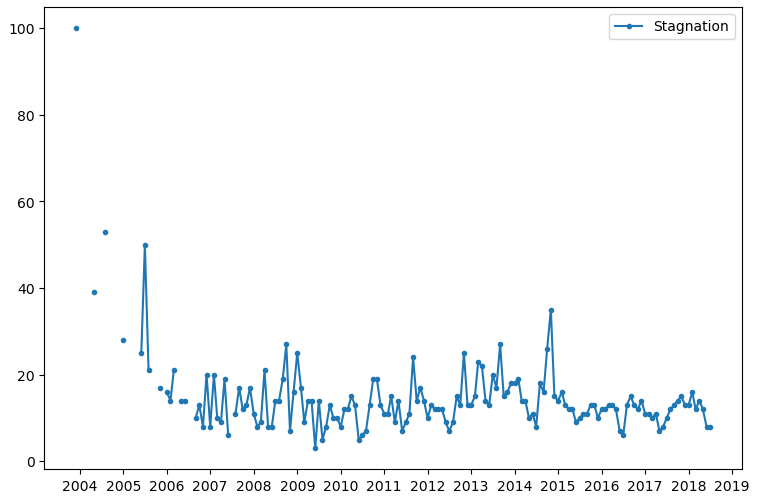
fig, ax = plt.subplots(figsize=(9, 6))
ax.plot('Date', 'Stagnation', '.-', data=df)
ax.legend()

ax.xaxis.set_major_locator(mdates.YearLocator())
ax.xaxis.set_major_formatter(mdates.DateFormatter("%Y"))

enter image description here

Editorialize answered 24/4, 2023 at 21:27 Comment(0)
P
20
import numpy as np
import pandas as pd
from matplotlib import pyplot as plt
import seaborn as sns

# Make example data
s = """2018-01-01
2018-01-02,100
2018-01-03,105
2018-01-04
2018-01-05,95
2018-01-06,90
2018-01-07,80
2018-01-08
2018-01-09"""
df = pd.DataFrame([row.split(",") for row in s.split("\n")], columns=["Date", "Data"])
df = df.replace("", np.nan)
df["Date"] = pd.to_datetime(df["Date"])
df["Data"] = df["Data"].astype(float)

Three options:

1) Use pandas or matplotlib.

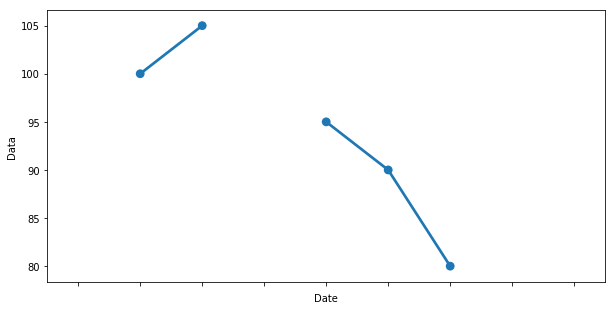
2) If you need seaborn: not what it's for but for regular dates like yours you can use pointplot out of the box.

fig, ax = plt.subplots(figsize=(10, 5))

plot = sns.pointplot(
    ax=ax,
    data=df, x="Date", y="Data"
)

ax.set_xticklabels([])

plt.show()

enter image description here

3) If you need seaborn and you need lineplot: I've looked at the source code and it looks like lineplot drops nans from the DataFrame before plotting. So unfortunately it's not possible to do it properly. You could use some advanced hackery though and use the hue argument to put the separate sections in separate buckets. We number the sections using the occurrences of nans.

fig, ax = plt.subplots(figsize=(10, 5))

plot = sns.lineplot(
    ax=ax,
    data=df, x="Date", y="Data",
    hue=df["Data"].isna().cumsum(), palette=["black"]*sum(df["Data"].isna()), legend=False, markers=True
)
ax.set_xticklabels([])

plt.show()

enter image description here

Unfortunately the markers argument appears to be broken currently so you'll need to fix it if you want to see dates that have nans on either side.

Puling answered 30/8, 2018 at 15:13 Comment(0)
P
5

Based on Denziloe answer:

there are three options:

1) Use pandas or matplotlib.

2) If you need seaborn: not what it's for but for regular dates like abovepointplot can use out of the box.

fig, ax = plt.subplots(figsize=(10, 5))

plot = sns.pointplot(
    ax=ax,
    data=df, x="Date", y="Data"
)

ax.set_xticklabels([])

plt.show()

graph built on data from the question will look as below: enter image description here

Pros:

  • easy to implement
  • an outlier in the data which is surrounded by None will be easy to notice on the graph

Cons:

  • it takes a long time to generate such a graph (compared to lineplot)
  • when there are many points it becomes hard to read such graphs

3) If you need seaborn and you need lineplot: hue argument can be used to put the separate sections in separate buckets. We number the sections using the occurrences of nans.

fig, ax = plt.subplots(figsize=(10, 5))

plot = sns.lineplot(
    ax=ax
    , data=df, x="Date", y="Data"
    , hue=df["Data"].isna().cumsum()
    , palette=["blue"]*sum(df["Data"].isna())
    , legend=False, markers=True
)

ax.set_xticklabels([])

plt.show()

Pros:

  • lineplot
  • easy to read
  • generated faster than point plot

Cons:

  • an outlier in the data which is surrounded by None will not be drawn on the chart

The graph will look as below: enter image description here

Pascale answered 30/8, 2018 at 16:20 Comment(0)
C
5

Try setting NaN values to np.inf -- Seaborn doesn't draw those points, and doesn't connect the points before with points after.

Curler answered 2/10, 2020 at 13:49 Comment(2)
Incorrect, experiment for yourself with below code (by adding/removing the inf part): ``` x = np.arange(10.); y = (-1) ** x; y[5] = np.nan; y[5] = np.inf; df = pd.DataFrame({'x': x, 'y': y}); sns.lineplot(data=df, x='x', y='y'); ```Flower
Downvoting. Seaborn does connect the values.Sciamachy
E
1
  • Since the data is already in a pandas.DataFrame, the easiest solution is to plot directly with pandas.DataFrame.plot, which uses matplotlib as the default plotting backend.
    • Incidentally, seaborn is a high-level API for matplotlib.
  • Tested in python 3.11.2, pandas 2.0.0, matplotlib 3.7.1
import pandas as pd
import matplotlib.pyplot as plt
import matplotlib.dates as mdates

# load the csv file
df = pd.read_csv('d:/data/hh.ru_stack.csv')

# convert the date column to a datetime.date
df.Date = pd.to_datetime(df.Date, format='%d-%m-%y').dt.date

# plot with markers
ax = df.plot(x='Date', marker='.', figsize=(9, 6))

# set the ticks for every year if desired
ax.xaxis.set_major_locator(mdates.YearLocator())
ax.xaxis.set_major_formatter(mdates.DateFormatter("%Y"))

enter image description here

fig, ax = plt.subplots(figsize=(9, 6))
ax.plot('Date', 'Stagnation', '.-', data=df)
ax.legend()

ax.xaxis.set_major_locator(mdates.YearLocator())
ax.xaxis.set_major_formatter(mdates.DateFormatter("%Y"))

enter image description here

Editorialize answered 24/4, 2023 at 21:27 Comment(0)
S
1

Set markers parameter to empty string. It will trigger a UserWarning but have the desired effect.

sns.pointplot(data=df, x='Date', y='Data', markers='')
Sapling answered 25/9, 2023 at 12:59 Comment(0)
A
0

A small change in the source code can also help you out:

diff --git a/seaborn/relational.py b/seaborn/relational.py
index ff0701c7..f4ab8cd9 100644
--- a/seaborn/relational.py
+++ b/seaborn/relational.py
@@ -273,7 +265,7 @@ class _LinePlotter(_RelationalPlotter):
 
         # Loop over the semantic subsets and add to the plot
         grouping_vars = "hue", "size", "style"
-        for sub_vars, sub_data in self.iter_data(grouping_vars, from_comp_data=True):
+        for sub_vars, sub_data in self.iter_data(grouping_vars, from_comp_data=True, dropna=False):
 
             if self.sort:
                 sort_vars = ["units", orient, other]

Found here: https://github.com/mwaskom/seaborn/issues/3351#issuecomment-1530086862

For future reference, there is an open issue: https://github.com/mwaskom/seaborn/issues/1552

But could not be fixed at the moment because of "some snags".

Abstractionism answered 27/3 at 14:35 Comment(0)

© 2022 - 2024 — McMap. All rights reserved.