Contour/imshow plot for irregular X Y Z data
Asked Answered
P

6

28

I have data in X, Y, Z format where all are 1D arrays, and Z is the amplitude of the measurement at coordinate (X,Y). I'd like to show this data as a contour or 'imshow' plot where the contours/color represent the the value Z (amplitude).

The grid for measurements and X and Y look are irregularly spaced.

Many thanks,

len(X)=100

len(Y)=100

len(Z)=100

Propellant answered 18/11, 2014 at 21:30 Comment(3)
Possibly duplicate of: #3242882Achondrite
have your tried something? you got any errors?Dermatologist
The other post's focus is mostly on interpolating the irregular data in 2D. I don't need/want interpolation.Propellant
B
60

Does plt.tricontourf(x,y,z) satisfy your requirements?

It will plot filled contours for irregularly spaced data (non-rectilinear grid).

You might also want to look into plt.tripcolor().

import numpy as np
import matplotlib.pyplot as plt
x = np.random.rand(100)
y = np.random.rand(100)
z = np.sin(x)+np.cos(y)
f, ax = plt.subplots(1,2, sharex=True, sharey=True)
ax[0].tripcolor(x,y,z)
ax[1].tricontourf(x,y,z, 20) # choose 20 contour levels, just to show how good its interpolation is
ax[1].plot(x,y, 'ko ')
ax[0].plot(x,y, 'ko ')
plt.savefig('test.png')

tripcolor and tricontourf example

Baking answered 18/11, 2014 at 22:0 Comment(9)
yes indeed, but still the plot is too rough. I am looking into ways to make it looks smoother. Thanks!Propellant
@Scientist, when I use tripcolor and also have it plot the (random) points I generated, I see it cannot be more accurate: a correct triangulation is made, and these patches are then filled based on the values in the nodes of the triangles.Baking
Oliver, thank you for your input. I will push and see whether I can re-arrange the 1-D arrays so that plt.contour can use it.Propellant
@Scientist, there is no need to rearrange the values for plt.contour. Just look at tricontourf (shown in the figure) or tricontour (if you don't like filled contours).Baking
Figured a solution: By increasing the "linewidths" option in tricontour, smoothing can be achieved. Cheers...Propellant
@Scientist, the option linewidths doesn't make the lines "smoother", it just makes the contourlines thicker. That's not smoothing, but it looks like you have what you need.Baking
Yes, indeed. it's only a de-facto solution. I couldn't find a way to 'smooth' the overall contours with tricontour.Propellant
Exactly what I'm looking for. Thanks, Oliver W.!Middlings
is this command similar to matlab's patch(), where you specify edges and vertex values?Dympha
S
4

After six years, I may be a little late to the party, but the following extension of Oliver W.'s answer using the Gouraud interpolation might give the 'smooth' result:

import numpy as np
import matplotlib.pyplot as plt
np.random.seed(1234)  # fix seed for reproducibility
x = np.random.rand(100)
y = np.random.rand(100)
z = np.sin(x)+np.cos(y)
f, ax = plt.subplots(1,2, sharex=True, sharey=True, clear=True)
for axes, shading in zip(ax, ['flat', 'gouraud']):
    axes.tripcolor(x,y,z, shading=shading)
    axes.plot(x,y, 'k.')
    axes.set_title(shading)
plt.savefig('shading.png')

comparison between flat and gouraud shading

Sulphurize answered 12/11, 2021 at 10:36 Comment(1)
This answer does not work for non convex forms :(Mattah
S
2

(Source code @ the end...)

Here's a little bit of eye candy that I produced playing around with this a bit. It explores the fact that a linear transformation of a meshgrid is still a meshgrid. I.e. on the left of all of my plots, I'm working with X and Y coordinates for a 2-d (input) function. On the right, I want to work with (AVG(X, Y), Y-X) coordinates for the same function.

I played around with making meshgrids in native coordinates and transforming them into meshgrids for the other coordinates. Works fine if the transform is linear.

For the bottom two graphs, I worked with random sampling to address your question directly.

Here are the images with setlims=False: enter image description here

And the same with setlims=True: enter image description here

import numpy as np
import pandas as pd
import matplotlib.pyplot as plt
import seaborn as sns

def f(x, y):
    return y**2 - x**2
lim = 2
xlims = [-lim , lim]
ylims = [-lim, lim]

setlims = False

pde = 1
numpts = 50
numconts = 20

xs_even = np.linspace(*xlims, num=numpts)
ys_even = np.linspace(*ylims, num=numpts)

xs_rand = np.random.uniform(*xlims, size=numpts**2)
ys_rand = np.random.uniform(*ylims, size=numpts**2)

XS_even, YS_even = np.meshgrid(xs_even, ys_even)

levels = np.linspace(np.min(f(XS_even, YS_even)), np.max(f(XS_even, YS_even)), num=numconts)

cmap = sns.blend_palette([sns.xkcd_rgb['cerulean'], sns.xkcd_rgb['purple']], as_cmap=True)

fig, axes = plt.subplots(3, 2, figsize=(10, 15))

ax = axes[0, 0]
H = XS_even
V = YS_even
Z = f(XS_even, YS_even)
ax.contour(H, V, Z, levels, cmap=cmap)
ax.plot(H.flatten()[::pde], V.flatten()[::pde], linestyle='None', marker='.', color='.75', alpha=0.5, zorder=1, markersize=4)
if setlims:
    ax.set_xlim([-lim/2., lim/2.])
    ax.set_ylim([-lim/2., lim/2.])
ax.set_xlabel('X')
ax.set_ylabel('Y')
ax.set_title('Points on grid, contour')

ax = axes[1, 0]
H = H.flatten()
V = V.flatten()
Z = Z.flatten()
ax.tricontour(H, V, Z, levels, cmap=cmap)
ax.plot(H.flatten()[::pde], V.flatten()[::pde], linestyle='None', marker='.', color='.75', alpha=0.5, zorder=1, markersize=4)
if setlims:
    ax.set_xlim([-lim/2., lim/2.])
    ax.set_ylim([-lim/2., lim/2.])
ax.set_xlabel('X')
ax.set_ylabel('Y')
ax.set_title('Points on grid, tricontour')

ax = axes[0, 1]
H = (XS_even + YS_even) / 2.
V = YS_even - XS_even
Z = f(XS_even, YS_even)
ax.contour(H, V, Z, levels, cmap=cmap)
ax.plot(H.flatten()[::pde], V.flatten()[::pde], linestyle='None', marker='.', color='.75', alpha=0.5, zorder=1, markersize=4)
if setlims:
    ax.set_xlim([-lim/2., lim/2.])
    ax.set_ylim([-lim, lim])
ax.set_xlabel('AVG')
ax.set_ylabel('DIFF')
ax.set_title('Points on transformed grid, contour')

ax = axes[1, 1]
H = H.flatten()
V = V.flatten()
Z = Z.flatten()
ax.tricontour(H, V, Z, levels, cmap=cmap)
ax.plot(H.flatten()[::pde], V.flatten()[::pde], linestyle='None', marker='.', color='.75', alpha=0.5, zorder=1, markersize=4)
if setlims:
    ax.set_xlim([-lim/2., lim/2.])
    ax.set_ylim([-lim, lim])
ax.set_xlabel('AVG')
ax.set_ylabel('DIFF')
ax.set_title('Points on transformed grid, tricontour')

ax=axes[2, 0]
H = xs_rand
V = ys_rand
Z = f(xs_rand, ys_rand)
ax.tricontour(H, V, Z, levels, cmap=cmap)
ax.plot(H[::pde], V[::pde], linestyle='None', marker='.', color='.75', alpha=0.5, zorder=1, markersize=4)
if setlims:
    ax.set_xlim([-lim/2., lim/2.])
    ax.set_ylim([-lim/2., lim/2.])
ax.set_xlabel('X')
ax.set_ylabel('Y')
ax.set_title('Points random, tricontour')

ax=axes[2, 1]
H = (xs_rand + ys_rand) / 2.
V = ys_rand - xs_rand
Z = f(xs_rand, ys_rand)
ax.tricontour(H, V, Z, levels, cmap=cmap)
ax.plot(H[::pde], V[::pde], linestyle='None', marker='.', color='.75', alpha=0.5, zorder=1, markersize=4)
if setlims:
    ax.set_xlim([-lim/2., lim/2.])
    ax.set_ylim([-lim, lim])
ax.set_xlabel('AVG')
ax.set_ylabel('DIFF')
ax.set_title('Points random transformed, tricontour')

fig.tight_layout()
Statute answered 11/2, 2015 at 16:17 Comment(0)
C
1

Scatter plot may work in your case:

import numpy as np
import matplotlib.pyplot as plt

# Generate random data, x,y for coordinates, z for values(amplitude)
x = np.random.rand(100)
y = np.random.rand(100)
z = np.random.rand(100)

# Scatter plot
plt.scatter(x=x,y=y,c=z)

Use the option c to visualize your amplitude.

Coparcener answered 29/1, 2021 at 2:11 Comment(0)
D
0

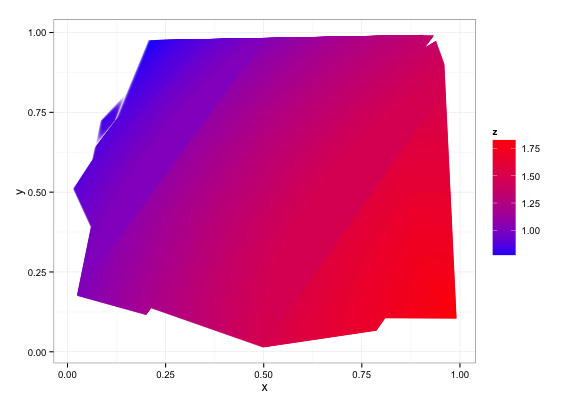
Well if you are prepared to deviate from Python into its competitor, R, I have just submitted a package to CRAN (should be available tomorrow or the next day), which conducts contouring on non-regular grids -- the following can be achieved in a few lines of code:

library(contoureR)
set.seed(1)
x = runif(100)
y = runif(100)
z = sin(x) + cos(y)
df = getContourLines(x,y,z,binwidth=0.0005)
ggplot(data=df,aes(x,y,group=Group)) + 
  geom_polygon(aes(fill=z)) + 
  scale_fill_gradient(low="blue",high="red") + 
  theme_bw()

Which produces the following:

example

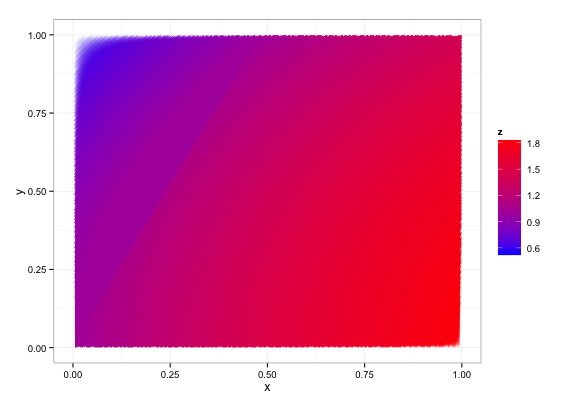
If you want a more regular grid, and can afford a bit of extra computation time:

x = seq(0,1,by=0.005)
y = seq(0,1,by=0.005)
d = expand.grid(x=x,y=y)
d$z = with(d,sin(x) + cos(y))
df = getContourLines(d,binwidth=0.0005)
ggplot(data=df,aes(x,y,group=Group)) + 
  geom_polygon(aes(fill=z)) + 
  scale_fill_gradient(low="blue",high="red") + 
  theme_bw()

example2

The fuzzy edges in the above, I know how to resolve and should be fixed for the next version of the software....

Dachia answered 21/8, 2015 at 10:42 Comment(0)
B
-1
xx, yy = np.meshgrid(x, y)

plt.contour(xx, yy, z)

Doesn't matter if they are irregularly spaced, contour and 3d plots require a meshgrid.

Brettbretz answered 19/11, 2014 at 1:42 Comment(13)
Z has to be two dimensional in this case. Does not work with 1-D arrays.Propellant
Are you sure you dont want a lines3d plot? Sounds more like what your data is built forBrettbretz
positive. I need a contour plot. When I say they are 1-D arrays, I am not saying all elements are sorted and represent a line. x-y make up a nice -irregularly spaced- grid, with each point having a corresponding Z value.Propellant
If Z is 1-D data, it's just not going to work on a contour plot. By definition, contour pots requre Z values to be a 2d matrix. Think about it, every value on your contour point has to exist at some x and y point, so it has to be 2d. But 3 1-d lines can be plotted as lines3d: matplotlib.org/mpl_toolkits/mplot3d/tutorial.html Otherwise, you're going to need your Z data to be a function of X and Y.Brettbretz
Ah I see the tricolor plot does work for this data type!Brettbretz
I don't think so! Although "contour" is set up to accept 2-D arrays only... That's why I raised the issue. "every value on your contour point has to exist at some x and y point", absolutely right, and this can be done with 1-D arrays. Every element in Z, corresponds to the amplitude of the element that has coordinates (X,Y). This can be set up in 2-D, but also in 1-D. 2-D is NOT an absolute must to assign Z values for a grid of X & Y.Propellant
It did indeed, but it is not as versatile as 'contour' and looks very rough/ugly b/c it utilizes a triangulation 'algorithm'.Propellant
Hmm, what if you made Z into a mesh grid by taking it as its own mesh? IE: ZZ = np.meshgrid(z, z)Brettbretz
That's an interesting idea. Let me try!Propellant
Actually, it just occurred to me that if you turn your data into an X,Y matrix where the values are Z, you can also use imshow, not just contours.Brettbretz
I have been trying to do this. But then, x and y have to be converted into 2D arrays as well. At least for me, this process has not been trivial. Any pointers on how to convert 1-D arrays (x,y,z) into 2D-arrays (X,Y,Z) that can be used with imshow or contour?Propellant
I think the reason you're having this much trouble is because if I understand, you have X and Y coordinates. Let's say x = 1,2,3,4,5 and y = 1,2,3,4,5. Most two dimensional data is actually made for a grid, so that your Z(x, y) would not be 5 values, but 5x5 values. For example, Z(x=1, y=1) = 1, Z(x=1, y=2) ... but your Z data is also 1 dimensional, yes? If se, what do you think it should look like in 2d? Maybe take this to the matplotlib mailing list?Brettbretz
In fact my 1-D arrays look like: x= 1,1,1,1,2,2,2,2... and y=1,2,3,4,1,2,3,4... So, indeed the x-y values cover almost the whole grid but not perfectly. That is ok though. There should be a neat pythonic way to plot these as a contour without invoking brute-force for loops.Propellant

© 2022 - 2024 — McMap. All rights reserved.