How to plot multiple Seaborn Jointplot in Subplot
Asked Answered
H

5

73

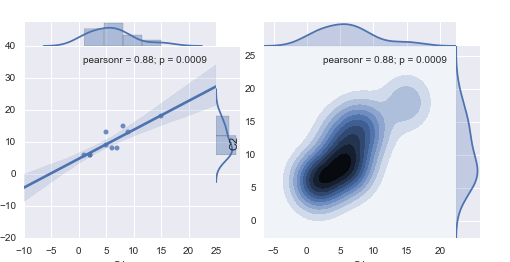
I'm having problem placing Seaborn Jointplot inside a multicolumn subplot.

import pandas as pd
import seaborn as sns

df = pd.DataFrame({'C1': {'a': 1,'b': 15,'c': 9,'d': 7,'e': 2,'f': 2,'g': 6,'h': 5,'k': 5,'l': 8},
          'C2': {'a': 6,'b': 18,'c': 13,'d': 8,'e': 6,'f': 6,'g': 8,'h': 9,'k': 13,'l': 15}})

fig = plt.figure();   
ax1 = fig.add_subplot(121);  
ax2 = fig.add_subplot(122);

sns.jointplot("C1", "C2", data=df, kind='reg', ax=ax1)
sns.jointplot("C1", "C2", data=df, kind='kde', ax=ax2)

Notice how only a portion of the jointplot is placed inside the subplot and the rest left inside another two plot frames. What I'd want is to have both the distributions also inserted inside the subplots.

Can anyone help with this?

Hadwin answered 27/1, 2016 at 16:5 Comment(0)
S
74

Moving axes in matplotlib is not as easy as it used to be in previous versions. The below is working with the current version of matplotlib.

As has been pointed out at several places (this question, also this issue) several of the seaborn commands create their own figure automatically. This is hardcoded into the seaborn code, so there is currently no way to produce such plots in existing figures. Those are PairGrid, FacetGrid, JointGrid, pairplot, jointplot and lmplot.

There is a seaborn fork available which would allow to supply a subplot grid to the respective classes such that the plot is created in a preexisting figure. To use this, you would need to copy the axisgrid.py from the fork to the seaborn folder. Note that this is currently restricted to be used with matplotlib 2.1 (possibly 2.0 as well).

An alternative could be to create a seaborn figure and copy the axes to another figure. The principle of this is shown in this answer and could be extended to Searborn plots. The implementation is a bit more complicated that I had initially expected. The following is a class SeabornFig2Grid that can be called with a seaborn grid instance (the return of any of the above commands), a matplotlib figure and a subplot_spec, which is a position of a gridspec grid.

Note: This is a proof of concept, it may work for most easy cases, but I would not recommend using it in production code.

import matplotlib.pyplot as plt
import matplotlib.gridspec as gridspec
import seaborn as sns
import numpy as np

class SeabornFig2Grid():

    def __init__(self, seaborngrid, fig,  subplot_spec):
        self.fig = fig
        self.sg = seaborngrid
        self.subplot = subplot_spec
        if isinstance(self.sg, sns.axisgrid.FacetGrid) or \
            isinstance(self.sg, sns.axisgrid.PairGrid):
            self._movegrid()
        elif isinstance(self.sg, sns.axisgrid.JointGrid):
            self._movejointgrid()
        self._finalize()

    def _movegrid(self):
        """ Move PairGrid or Facetgrid """
        self._resize()
        n = self.sg.axes.shape[0]
        m = self.sg.axes.shape[1]
        self.subgrid = gridspec.GridSpecFromSubplotSpec(n,m, subplot_spec=self.subplot)
        for i in range(n):
            for j in range(m):
                self._moveaxes(self.sg.axes[i,j], self.subgrid[i,j])

    def _movejointgrid(self):
        """ Move Jointgrid """
        h= self.sg.ax_joint.get_position().height
        h2= self.sg.ax_marg_x.get_position().height
        r = int(np.round(h/h2))
        self._resize()
        self.subgrid = gridspec.GridSpecFromSubplotSpec(r+1,r+1, subplot_spec=self.subplot)

        self._moveaxes(self.sg.ax_joint, self.subgrid[1:, :-1])
        self._moveaxes(self.sg.ax_marg_x, self.subgrid[0, :-1])
        self._moveaxes(self.sg.ax_marg_y, self.subgrid[1:, -1])

    def _moveaxes(self, ax, gs):
        #https://mcmap.net/q/48700/-can-i-create-axessubplot-objects-then-add-them-to-a-figure-instance
        ax.remove()
        ax.figure=self.fig
        self.fig.axes.append(ax)
        self.fig.add_axes(ax)
        ax._subplotspec = gs
        ax.set_position(gs.get_position(self.fig))
        ax.set_subplotspec(gs)

    def _finalize(self):
        plt.close(self.sg.fig)
        self.fig.canvas.mpl_connect("resize_event", self._resize)
        self.fig.canvas.draw()

    def _resize(self, evt=None):
        self.sg.fig.set_size_inches(self.fig.get_size_inches())

The usage of this class would look like this:

import matplotlib.pyplot as plt
import matplotlib.gridspec as gridspec
import seaborn as sns; sns.set()
import SeabornFig2Grid as sfg


iris = sns.load_dataset("iris")
tips = sns.load_dataset("tips")

# An lmplot
g0 = sns.lmplot(x="total_bill", y="tip", hue="smoker", data=tips, 
                palette=dict(Yes="g", No="m"))
# A PairGrid
g1 = sns.PairGrid(iris, hue="species")
g1.map(plt.scatter, s=5)
# A FacetGrid
g2 = sns.FacetGrid(tips, col="time",  hue="smoker")
g2.map(plt.scatter, "total_bill", "tip", edgecolor="w")
# A JointGrid
g3 = sns.jointplot("sepal_width", "petal_length", data=iris,
                   kind="kde", space=0, color="g")


fig = plt.figure(figsize=(13,8))
gs = gridspec.GridSpec(2, 2)

mg0 = sfg.SeabornFig2Grid(g0, fig, gs[0])
mg1 = sfg.SeabornFig2Grid(g1, fig, gs[1])
mg2 = sfg.SeabornFig2Grid(g2, fig, gs[3])
mg3 = sfg.SeabornFig2Grid(g3, fig, gs[2])

gs.tight_layout(fig)
#gs.update(top=0.7)

plt.show()

enter image description here

Note that there might be several drawbacks from copying axes and the above is not (yet) tested thoroughly.

Sural answered 5/12, 2017 at 23:44 Comment(13)
What modifications would be needed for ClusterGrid?Mitsue
@JackArnestad You would essentially need to recreate the grid used by seaborn. This would look similar to _movejointgrid but with four axes.Sural
@Sural Would it be too much to ask for you to update the answer with this? I am a beginner to Python and matplotlib and am not exactly sure how to go about doing this. I would really appreciate it. Thanks :)Mitsue
I think I remember not including clustergrid here because it would take almost as much code as creating the kind of plot manually.Sural
@Sural I see. Could you suggest or show how that should be done? I'm stuck and would really appreciate and guidance.Mitsue
@Sural However, the colrbar (cbar=True) can't be shown in the subplots. Do you have any solution? (You can check my question here)Souse
@XinZhang Correct, this solution does not care about colorbar axes. Since this is quite involved, I would propose to create them manually afterwards.Sural
@Sural But, I couldn't get the xaxis and yaxis to enlarge the fontsize.Souse
Update: rc and font_scale could solve the font problem.Souse
The legends, however, are not showing. I could add them by ax = plt.gca(); ax = plt.legend(). But that puts the legend inside the plot, unlike the default position outside of the plot. Does any one know a remedy?Sunk
In matplotlib 3.4.0 (unreleased yet), they will support subfigures. This seems to be a good solution.Hipped
This is awesome! What is the easiest way to add titles to the subfigures? In my case, I was putting two jointplots side by side so managed to titles with g1.ax_marg_x.set_title(...), but is their a more general way?Imogen
@JongsuLiamKim It seems that this still doesn't work trivially. See e.g. this example using subfigures where the three components are simply plotted separately. towardsdatascience.com/…Jed
M
39

It can not be easily done without hacking. jointplot calls JointGrid method, which in turn creates a new figure object every time it is called.

Therefore, the hack is to make two jointplots (JG1 JG2), then make a new figure, then migrate the axes objects from JG1 JG2 to the new figure created.

Finally, we adjust the sizes and the positions of subplots in the new figure we just created.

JG1 = sns.jointplot("C1", "C2", data=df, kind='reg')
JG2 = sns.jointplot("C1", "C2", data=df, kind='kde')

#subplots migration
f = plt.figure()
for J in [JG1, JG2]:
    for A in J.fig.axes:
        f._axstack.add(f._make_key(A), A)

#subplots size adjustment
f.axes[0].set_position([0.05, 0.05, 0.4,  0.4])
f.axes[1].set_position([0.05, 0.45, 0.4,  0.05])
f.axes[2].set_position([0.45, 0.05, 0.05, 0.4])
f.axes[3].set_position([0.55, 0.05, 0.4,  0.4])
f.axes[4].set_position([0.55, 0.45, 0.4,  0.05])
f.axes[5].set_position([0.95, 0.05, 0.05, 0.4])

It is a hack because we are now using _axstack and _add_key private methods, which might and might not stay the same as they are now in matplotlib future versions.

enter image description here

Madelyn answered 27/1, 2016 at 18:6 Comment(5)
It's hard for me to imagine that going to all this trouble is a better idea than just setting up the subplot grid and drawing distplot, regplot, and kdeplot onto it.Abbieabbot
Totally agree. But reusability wise, doing so would mean to duplicate a lot of codes already written in joint_plot. Maybe JointGird might take an optional parameter to specify plotting axes/axis. Current behavior would mean that if one supply ax=some_axis, only the regplot plot will go to that some_axis.Madelyn
That's just behavior that results from someone using the function in a way that was never intended.Abbieabbot
@Abbieabbot How do you mean, " using the function in a way that was never intended"? Can you explain?Trotman
I am getting an error with this (seaborn version 0.11.2): python 6 for J in [JG1, JG2]: 7 for A in J.fig.axes: ----> 8 f._axstack.add(f._make_key(A), A) 10 #subplots size adjustment 11 f.axes[0].set_position([0.05, 0.05, 0.4, 0.4]) AttributeError: 'Figure' object has no attribute '_make_key' Optician
P
7

Recently, I'm developing patchworklib, which is a subplot manager for matplotlib, inspired by patchwork. It allows you to quickly arrange multiple gridded seaborn plots using only / and | operators.

Here is the example code, which you can also run on Google colab:

import seaborn as sns
import patchworklib as pw 
sns.set_theme()
pw.overwrite_axisgrid() 

iris = sns.load_dataset("iris")
tips = sns.load_dataset("tips")

# An lmplot
g0 = sns.lmplot(x="total_bill", y="tip", hue="smoker", data=tips, 
                palette=dict(Yes="g", No="m"))
g0 = pw.load_seaborngrid(g0, label="g0")

# A Pairplot
g1 = sns.pairplot(iris, hue="species")
g1 = pw.load_seaborngrid(g1, label="g1")

# A relplot
g2 = sns.relplot(data=tips, x="total_bill", y="tip", col="time", hue="time", 
                 size="size", style="sex", palette=["b", "r"], sizes=(10, 100))
g2 = pw.load_seaborngrid(g2, label="g2")

# A JointGrid
g3 = sns.jointplot("sepal_width", "petal_length", data=iris,
                   kind="kde", space=0, color="g")

g3 = pw.load_seaborngrid(g3, label="g3")
(((g0|g1)["g0"]/g3)["g3"]|g2).savefig("seaborn_subplots.png")

seaborn_subplots.png

Pilar answered 22/1, 2022 at 20:9 Comment(0)
M
6

If you get into trouble despite the elegant solution of @ImportanceOfBeingErnest, you can still save seaborn plots to memory as images and use them to build your custom figure. Use other formats than '.png' if you seek a higher resolution.

Here is the example is shown above using this nasty (but working) approach:

import matplotlib.image as mpimg
import matplotlib.pyplot as plt
import seaborn as sns

# data
iris = sns.load_dataset("iris")
tips = sns.load_dataset("tips")

############### 1. CREATE PLOTS
# An lmplot
g0 = sns.lmplot(x="total_bill", y="tip", hue="smoker", data=tips, 
                palette=dict(Yes="g", No="m"))
# A PairGrid
g1 = sns.PairGrid(iris, hue="species")
g1.map(plt.scatter, s=5)
# A FacetGrid
g2 = sns.FacetGrid(tips, col="time",  hue="smoker")
g2.map(plt.scatter, "total_bill", "tip", edgecolor="w")
# A JointGrid
g3 = sns.jointplot("sepal_width", "petal_length", data=iris,
                   kind="kde", space=0, color="g")

############### 2. SAVE PLOTS IN MEMORY TEMPORALLY
g0.savefig('g0.png')
plt.close(g0.fig)

g1.savefig('g1.png')
plt.close(g1.fig)

g2.savefig('g2.png')
plt.close(g2.fig)

g3.savefig('g3.png')
plt.close(g3.fig)

############### 3. CREATE YOUR SUBPLOTS FROM TEMPORAL IMAGES
f, axarr = plt.subplots(2, 2, figsize=(25, 16))

axarr[0,0].imshow(mpimg.imread('g0.png'))
axarr[0,1].imshow(mpimg.imread('g1.png'))
axarr[1,0].imshow(mpimg.imread('g3.png'))
axarr[1,1].imshow(mpimg.imread('g2.png'))

# turn off x and y axis
[ax.set_axis_off() for ax in axarr.ravel()]

plt.tight_layout()
plt.show()

The four subplots are shown together in the following image

Momently answered 20/4, 2020 at 19:4 Comment(1)
Why would someone want to save the files!!Surmount
A
0

Following on @<https://stackoverflow.com/users/4124317/importanceofbeingernest answer>. I have added an additional function _moveclustergrid to his Class to deal with seaborn's clusterheatmaps (ClusterGrid class).

class SeabornFig2Grid():
    """Class from https://mcmap.net/q/48143/-how-to-iteratively-populate-matplotlib-gridspec-with-a-multipart-seaborn-plot-duplicate/47624348#47624348"""
    def __init__(self, seaborngrid, fig,  subplot_spec):
        self.fig = fig
        self.sg = seaborngrid
        self.subplot = subplot_spec
        if isinstance(self.sg, sns.axisgrid.FacetGrid) or \
            isinstance(self.sg, sns.axisgrid.PairGrid):
            self._movegrid()
        elif isinstance(self.sg, sns.axisgrid.JointGrid):
            self._movejointgrid()
        elif isinstance(self.sg, sns.matrix.ClusterGrid):
            self._moveclustergrid()
        else:
            print("what am i?")

        self._finalize()

    def _movegrid(self):
        """ Move PairGrid or Facetgrid """
        self._resize()
        n = self.sg.axes.shape[0]
        m = self.sg.axes.shape[1]
        self.subgrid = gridspec.GridSpecFromSubplotSpec(n,m, subplot_spec=self.subplot)
        for i in range(n):
            for j in range(m):
                self._moveaxes(self.sg.axes[i,j], self.subgrid[i,j])

    def _movejointgrid(self):
        """ Move Jointgrid """
        h= self.sg.ax_joint.get_position().height
        h2= self.sg.ax_marg_x.get_position().height
        r = int(np.round(h/h2))
        self._resize()
        self.subgrid = gridspec.GridSpecFromSubplotSpec(r+1,r+1, subplot_spec=self.subplot)

        self._moveaxes(self.sg.ax_joint, self.subgrid[1:, :-1])
        self._moveaxes(self.sg.ax_marg_x, self.subgrid[0, :-1])
        self._moveaxes(self.sg.ax_marg_y, self.subgrid[1:, -1])

    def _moveclustergrid(self):
        """Move Cluster grid"""
        r = len(self.sg.figure.axes)
        self.subgrid = gridspec.GridSpecFromSubplotSpec(r, r + 10, subplot_spec=self.subplot)
        subplots_axes = self.sg.figure.axes

        self._resize()
        self._moveaxes(subplots_axes[0], self.subgrid[1:, 0:3]) #left cladogram
        self._moveaxes(subplots_axes[1], self.subgrid[0, 4:-2]) #top cladogram
        self._moveaxes(subplots_axes[2], self.subgrid[1:, 3]) #labels bar
        self._moveaxes(subplots_axes[3], self.subgrid[1:, 4:-3]) #heatmap
        self._moveaxes(subplots_axes[4], self.subgrid[1:, -1]) #colorbar


    def _moveaxes(self, ax, gs):
        #https://mcmap.net/q/48700/-can-i-create-axessubplot-objects-then-add-them-to-a-figure-instance
        ax.remove()
        ax.figure=self.fig
        self.fig.axes.append(ax)
        self.fig.add_axes(ax)
        ax._subplotspec = gs
        ax.set_position(gs.get_position(self.fig))
        ax.set_subplotspec(gs)

    def _finalize(self):
        plt.close(self.sg.fig)
        self.fig.canvas.mpl_connect("resize_event", self._resize)
        self.fig.canvas.draw()

    def _resize(self, evt=None):
        self.sg.fig.set_size_inches(self.fig.get_size_inches())


It is not 100% "pretty-plot" proof, but it gives a place to start. Just change the locations of the subplots by modifying the number of rows and columns that they use in self.subgrid[rows,columns]

Please see the output in the link (I do not have enough reputation to embed images): clustermaps_side_by_side

Alfonsoalfonzo answered 18/8, 2023 at 15:39 Comment(0)

© 2022 - 2024 — McMap. All rights reserved.