In order to set the custom break intervals for a log scale in a ggplot2 chart, I created the following vector from multiple sequences.
breaks <- c(seq(2000, 10000, by = 1000),
        seq(20000, 100000, by = 10000),
        seq (200000, 1000000, by = 100000),
        seq (2000000,10000000, by = 1000000),
        seq (20000000,100000000, by = 10000000))
This is quick and dirty but it gives me the desired breaks from 2,000 to 100,000,000 in log intervals.
> breaks
 [1] 2e+03 3e+03 4e+03 5e+03 6e+03 7e+03 8e+03 9e+03 1e+04 2e+04 3e+04 4e+04
[13] 5e+04 6e+04 7e+04 8e+04 9e+04 1e+05 2e+05 3e+05 4e+05 5e+05 6e+05 7e+05
[25] 8e+05 9e+05 1e+06 2e+06 3e+06 4e+06 5e+06 6e+06 7e+06 8e+06 9e+06 1e+07
[37] 2e+07 3e+07 4e+07 5e+07 6e+07 7e+07 8e+07 9e+07 1e+08
How do I clean this snippet of code up to make it more flexible? A search of the many log sequence solutions, existing libraries and my own trial and error was not very fruitful.
Ideally, I would like to input From, To and NumberOfMinorIntervals as parameters into a simpler expression.


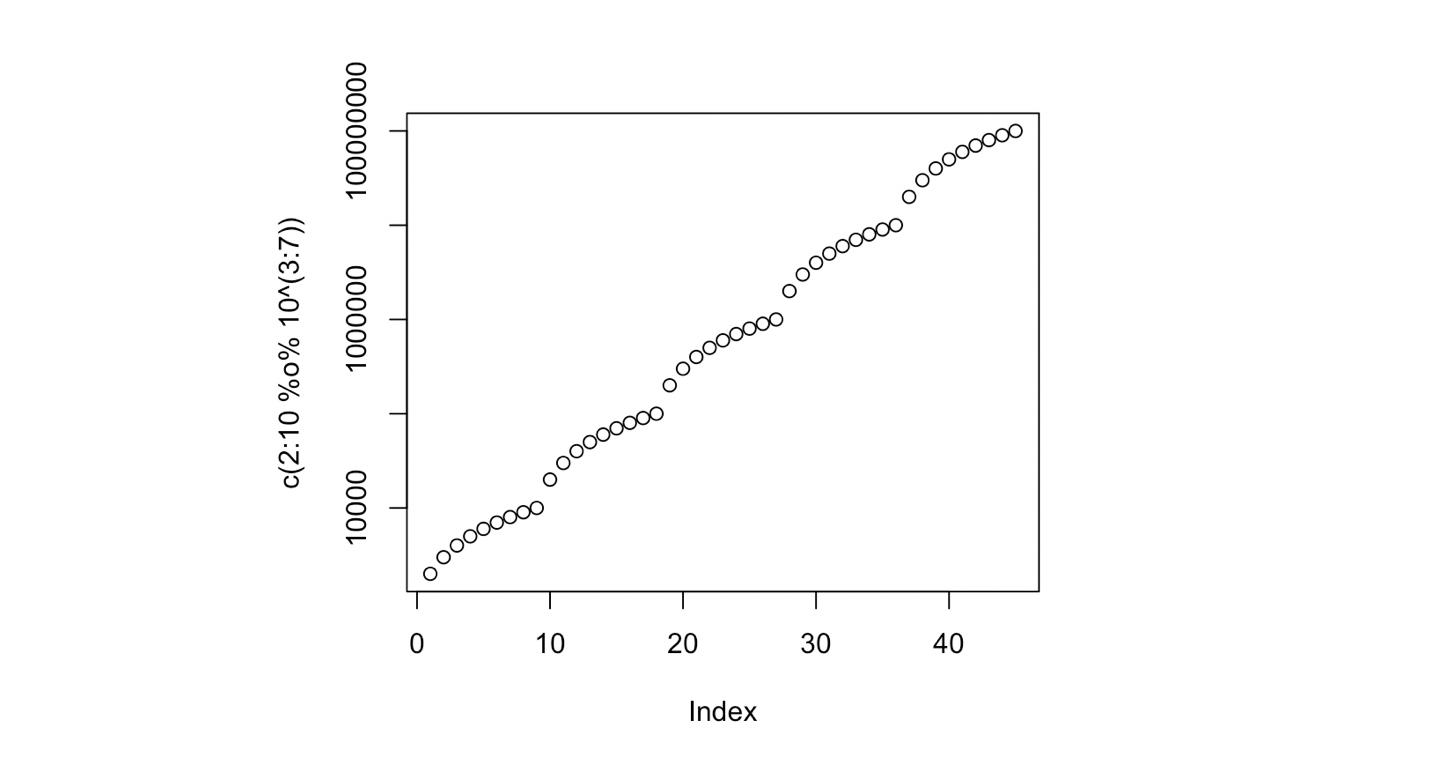
c(seq(2,10,10/10) %o% 10^(3:7))or something like this eventually...c(seq(2,10, 10/NumBreaks) %o% 10^(From:To))– Artamas