I've got some unit tests, and got some code coverage data. Now, I'd like to be able to view that code coverage data outside of visual studio, say in a web browser. But, when I export the code coverage to an xml file, I can't do anything with it. Are there readers out there for this? Do I have to write an xml parser and then display it how I want it (seems like a waste since visual studio already does this.) Seems kinda silly to have to take a screenshot of my code coverage results as my "report" Suggestions?
This tool https://github.com/danielpalme/ReportGenerator quickly generate Html reports from coverage file. Works quite well and does not require complex activities, can be easily included in the build process.
There is this tool called Visual Coverage (https://github.com/jsargiot/visual-coverage). It takes a .coverage file as input and can export it to clover or html.
The page on github shows how to execute and if you're curious you can take a look at the code...
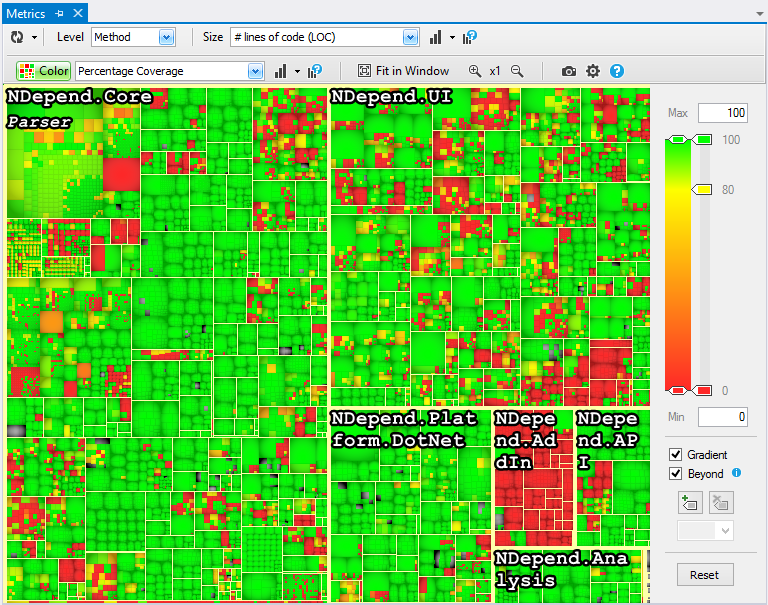
You can use the tool NDepend and visualize code coverage results imported from NCover, dotCover or Visual Studio coverage. The tool can show code coverage vs. lines of code in a colored treemap. This feature is especially useful to browse at a glance which portion of code is well covered or not by tests.
You can also write and apply continuously code rules written over LINQ queries (CQLinq) like:
From now, all types added or refactored should be 100% covered by tests
// <Name>From now, all types added or refactored should be 100% covered by tests</Name>
warnif count > 0 from t in JustMyCode.Types where

  // Match methods new or modified since Baseline for Comparison...
  (t.WasAdded() || t.CodeWasChanged()) &&

  // ...that are not 100% covered by tests
  t.PercentageCoverage < 100

  let methodsCulprit = t.Methods.Where(m => m.PercentageCoverage < 100)

select new { t, t.PercentageCoverage, methodsCulprit }
...or also:
- Types that used to be 100% covered but not anymore
- C.R.A.P method code metric
- Complex methods partially covered by tests should be 100% covered
The panel Search by Coverage can generate such Code Query over LINQ, and displays instantly the matched code elements:

Also, the tool can build a HTML/javascript reports that will show code rules violated or code queries results.
Now you can use the tool of dotnet for generate the report in html
dotnet tool install -g dotnet-reportgenerator-globaltool
reportgenerator
"-reports:Path\To\TestProject\TestResults\{guid}\coverage.cobertura.xml"
"-targetdir:coveragereport"
-reporttypes:Html
I can't speak for the content of the exported XML, but I'd expect it contain your coverage data as a summary.
The usual thing to do with XML data like this if you want to see it in a web browser page is to convert it to HTML by writing and running a custom XSLT script. This will presumably get you HTML text and tables containing your data.
If you want to see the coverage data as decorations imposed on the source code, I think you have a much harder problem.
Might help: you can open all the coverage data in the Code Coverage Results pane and copy&paste it to Excel...
I use NCover to do all my code coverage and you have the ability to export the results quite easily
© 2022 - 2024 — McMap. All rights reserved.

