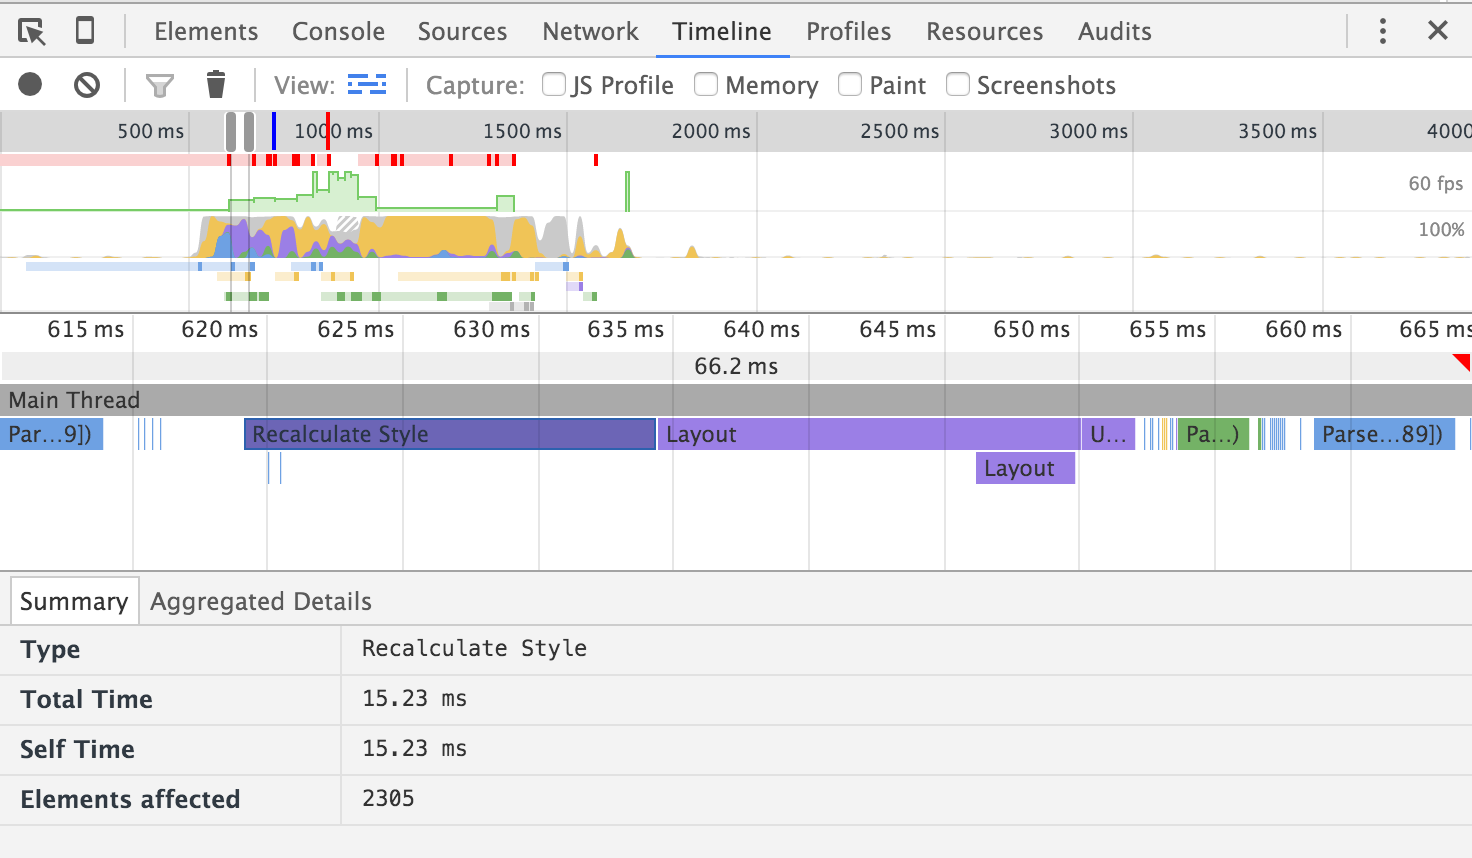
I think this question needs a little update, therefore I am adding another answer to it...
You can use the package profvis to profile shiny apps as well. It will give flame graphs directly for your R code. I.e. no need to use Chrome's flame graphs and guess where the bottleneck is. You will know exactly where to change your code.
Here is how to do it:
- Run shiny app via Profvis
- Interact with your shiny app
- Close browser
- Stop Console via Stop button
- Load profile
- If Step 5 fails, try this: Convert to html if needed (memory problems)
Details for certain steps are added below:
Step 1: Run profvis
library(profvis)
profvis({ runApp('directory_of_shiny_app') }
    , prof_output = '/directory_to_save_profile')
Step 5: Load your profile
profvis(prof_input = '/path_to_save_output/random_name.Rprof')
N.B. Profvis gives a random name to your file. So you need to change the input path accordingly
Step 6: Convert to html
This step might be needed, if you have a huge app and flame graph gets a little bit longer. You might get an error "Pandoc:... memory"
p <- profvis(prof_input = '/path_to_save_output/file108f93bff877b.Rprof')
htmlwidgets::saveWidget(p, "/path_to_save_output/profile.html")
Then open the html file in your browser.

