Adding a legend to a matplotlib boxplot with multiple plots on same axes
Asked Answered
C

3

30

I have a boxplot generated with matplotlib:

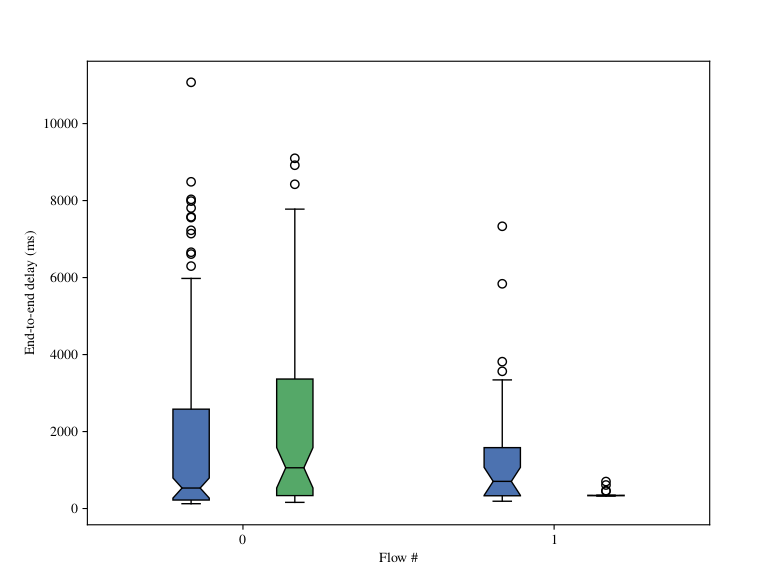
enter image description here

However, I have no idea how to generate the legend. I get a warning saying:

Legend does not support handles for dict instances.

or

No artists with labels found to put in legend.

I've done a fair bit of searching and there doesn't seem to be an example showing how to achieve this.

bp1 = ax.boxplot(data1, positions=[1,4], notch=True, widths=0.35, patch_artist=True)
bp2 = ax.boxplot(data2, positions=[2,5], notch=True, widths=0.35, patch_artist=True)

ax.legend([bp1, bp2], ['A', 'B'], loc='upper right')
Chema answered 28/11, 2017 at 10:13 Comment(0)
P
45

The boxplot returns a dictionary of artists

result : dict
A dictionary mapping each component of the boxplot to a list of the matplotlib.lines.Line2D instances created. That dictionary has the following keys (assuming vertical boxplots):

  • boxes: the main body of the boxplot showing the quartiles and the median’s confidence intervals if enabled.
  • [...]

Using the boxes, you can get the legend artists as

ax.legend([bp1["boxes"][0], bp2["boxes"][0]], ['A', 'B'], loc='upper right')

Complete example:

import matplotlib.pyplot as plt
import numpy as np; np.random.seed(1)

data1=np.random.randn(40,2)
data2=np.random.randn(30,2)

fig, ax = plt.subplots()
bp1 = ax.boxplot(data1, positions=[1,4], notch=True, widths=0.35, 
                 patch_artist=True, boxprops=dict(facecolor="C0"))
bp2 = ax.boxplot(data2, positions=[2,5], notch=True, widths=0.35, 
                 patch_artist=True, boxprops=dict(facecolor="C2"))

ax.legend([bp1["boxes"][0], bp2["boxes"][0]], ['A', 'B'], loc='upper right')

ax.set_xlim(0,6)
plt.show()

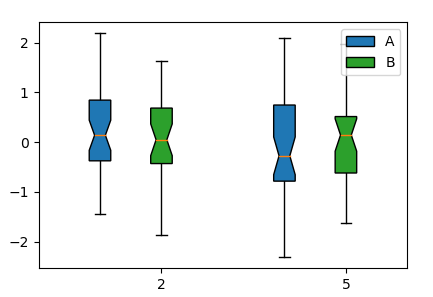
enter image description here

Pentacle answered 28/11, 2017 at 10:55 Comment(4)
Strange that this code didn't work for me. I wonder whether something happened with a version of pyplot. The legend shows up but there's nothing inside it. It seems that legend() clears it out.Injun
@ChrisA. Sorry, there was of course one ax.legend too much in the code. Corrected that.Pentacle
Hi @ImportanceOfBeingErnest, do you know how can I change the '2' and '5' labels? Like putting the name of the variable being presented or anything like thisBlanton
@dekio: this is done by ax.set_xticklabels(['A', 'B'])Flyer
A
4

Just as a complement to @ImportanceOfBeingErnest's response, if you are plotting in a for loop like this:

for data in datas:
    ax.boxplot(data, positions=[1,4], notch=True, widths=0.35, 
             patch_artist=True, boxprops=dict(facecolor="C0"))

You cannot save the plots as variables. So in that case, create legend labels list legends, append the plots into another list elements and use list comprehension to put a legend for each of them:

labels = ['A', 'B']
colors = ['blue', 'red']
elements = []

for data, color in zip(datas, colors):
    elements.append(ax.boxplot(data, positions=[1,4], notch=True,\
    widths=0.35, patch_artist=True, boxprops=dict(facecolor=color)))

ax.legend([element["boxes"][0] for element in elements], labels)
Acre answered 10/12, 2020 at 15:20 Comment(0)
I
0

New in matplotlib 3.9

Boxplots now include a label param to support legends, so it's much simpler now.

Just give a label to each boxplot, and then ax.legend() will automatically pick up the handles:

import matplotlib.pyplot as plt
import numpy as np

rng = np.random.default_rng(1)
data1 = rng.standard_normal((40, 2))
data2 = rng.standard_normal((30, 2))

fig, ax = plt.subplots()
ax.boxplot(data1, positions=[1, 4], patch_artist=True, boxprops={"facecolor": "C0"},
           label="A")  # label param requires matplotlib 3.9+
ax.boxplot(data2, positions=[2, 5], patch_artist=True, boxprops={"facecolor": "C2"},
           label="B")  # label param requires matplotlib 3.9+

ax.legend()  # will automatically detect the labels in matplotlib 3.9+

plt.show()

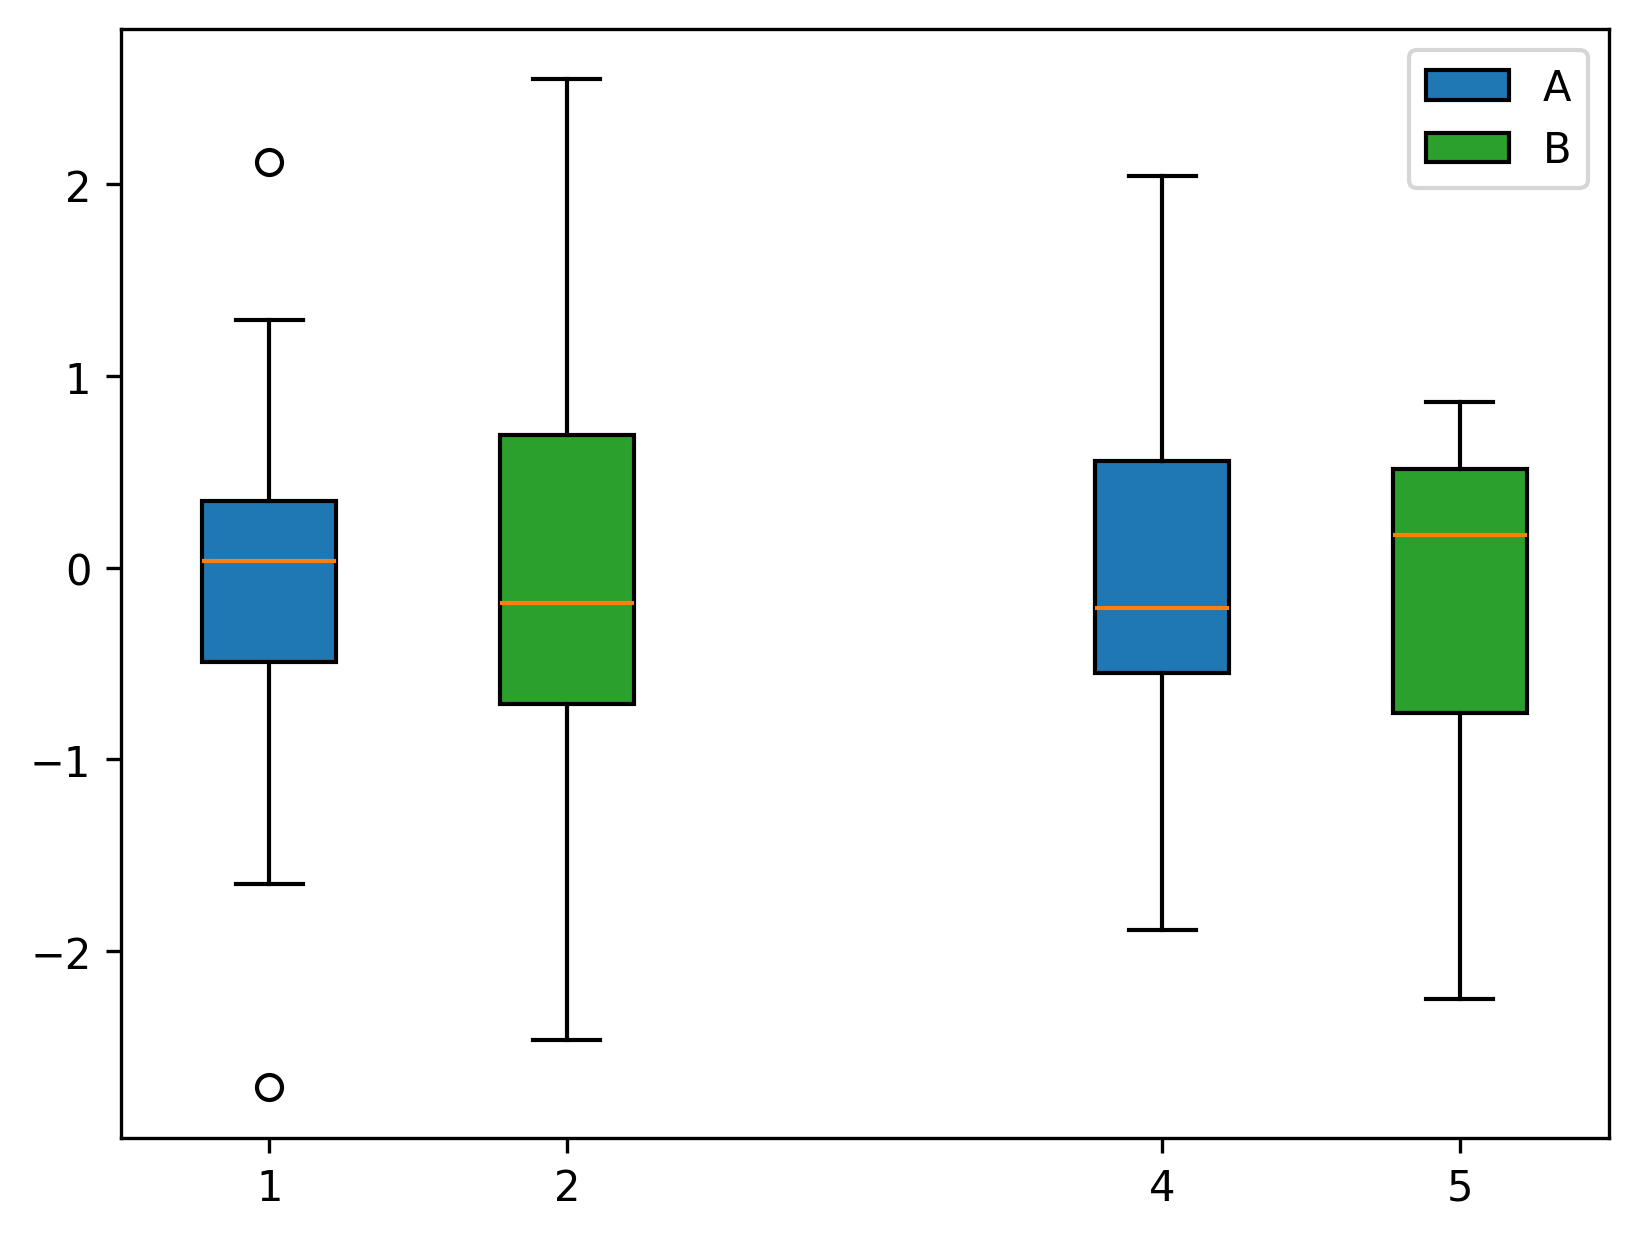
boxplot using ax.legend()

Infundibulum answered 16/5 at 14:59 Comment(0)

© 2022 - 2024 — McMap. All rights reserved.