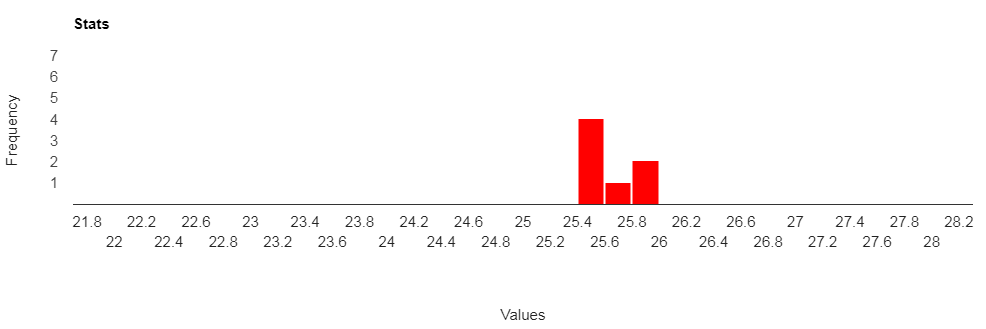
I am using Google Chart API to create a histogram and want to modify bars to fuse with the ones next to them and change the xticks to integers.
Question:
How can I do the following:
- Fuse the bars with the one next to them?
- Make the h/x-ticks appear as
ints?
Current Output:
Ideal Output:
Relevant Research:
I couldn't find all that much, apart from these two which helped with some of my problems but not the two above:
- How does one go about creating an Histogram using the google chart api?
- GOOGLE: Home > Products > Charts > Guides > Histogram
MWE:
google.charts.load("current", {packages: ["corechart"]});
google.charts.setOnLoadCallback(drawChart);

function drawChart() {
  var data = google.visualization.arrayToDataTable([
     ['MyData', 'Value'],
     ['Val', 25.4],
     ['Val', 25.4],
     ['Val', 25.4],
     ['Val', 25.4],
     ['Val', 25.6],
     ['Val', 25.8],
     ['Val', 25.8]
     ]);
  var options = {
   title: 'Stats',
   legend: {position: 'none'},
   width: 1100,
   height: 500,
   chartArea: {width: 900, height: 150},
   colors: ['#ff0000'],
   histogram: {bucketSize: 0.2, minValue: 22, maxValue: 28, hideBucketItems: true},
   // bar: { width: 5},
   // bar: {groupWidth: 0 },
   vAxis: {
      title: 'Frequency',
      titleTextStyle: {bold: false, italic: false},
      gridlines: {color: "white"},
      ticks: [1,2,3,4,5,6,7],
      }, //END V-AXIS
   hAxis: {
      title: 'Values',
      titleTextStyle: {bold: false, italic: false},
      type: 'category',
      ticks: [22, 23, 24, 25, 26, 27, 28], // THIS IS NOT WORKING?!!!?
      }  //END H-AXIS
  }; //END OPTIONS

  var chart = new google.visualization.Histogram(document.getElementById('chart_div'));
  chart.draw(data, options);
}
<script src="https://www.gstatic.com/charts/loader.js"></script>
<div id="chart_div"></div>


45.2? – Actinouranium