How to stop font size defaulting after zooming in on a google chart
Asked Answered
G

1

2

I am using Google Chart API to create a time-line graph and want the strings underneath the title of the graph to continue to be at the same font size, irrespective of the graph being zoomed in or not.

Question:

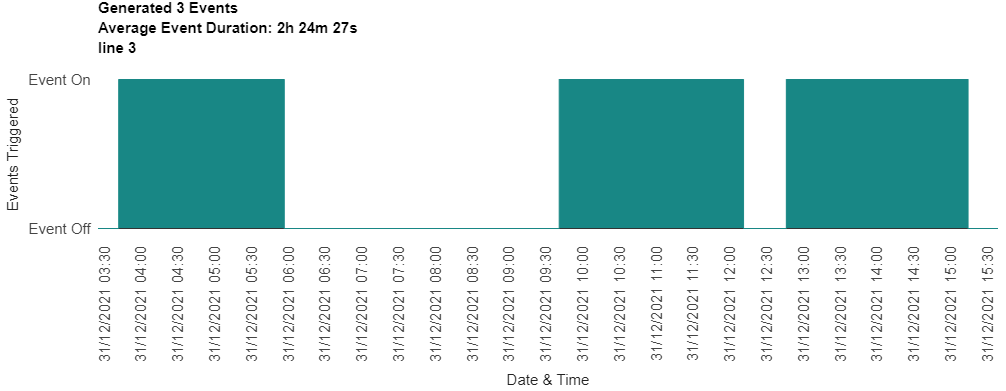
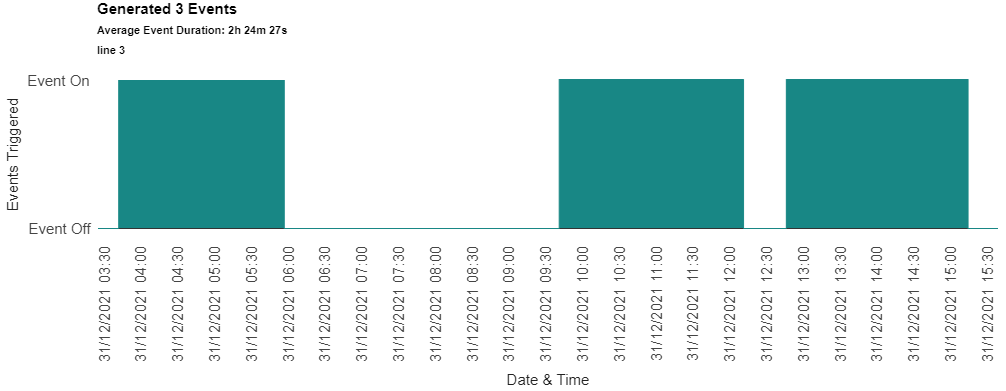
After I zoom in into the graph the strings (Average Event ..., line 3) underneath the title default to the original size, how can I make it so that when zoomed in, or after zooming in these lines (Average Event ..., line 3) continue to stay in the original text size

Current Output:

Before zooming:

enter image description here

After zooming:

enter image description here

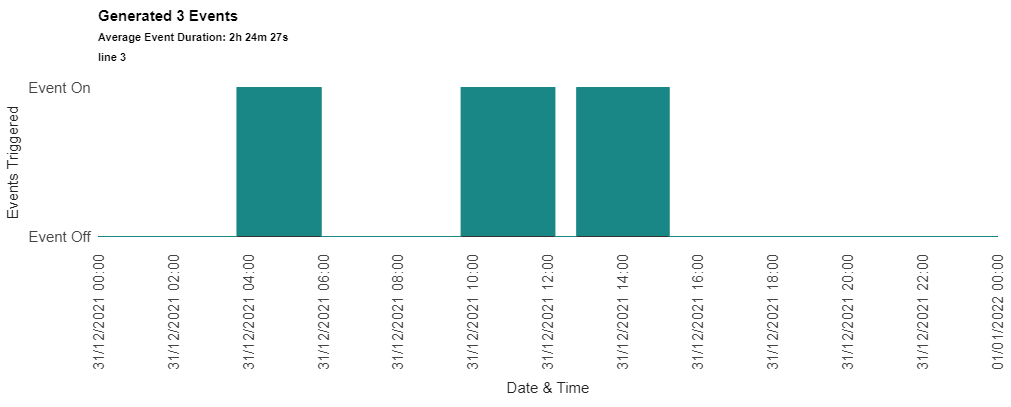
Ideal Output:

enter image description here

Relevant Research:

I could not find any reference, or anyone who had a similar issue.

MWE:

google.charts.load('current', {'packages':['corechart']})
google.charts.setOnLoadCallback(drawChart);

function drawChart() {
var data = new google.visualization.DataTable();
data.addColumn('date', 'Date \& Time');
data.addColumn('number', "Triggered Events");
data.addColumn({type: 'string', role: 'tooltip'});
data.addRows([
	[new Date(2021, 11, 31, 0, 0, 0), 0, ''],


	[new Date(2021, 11, 31, 3, 41, 44), 0, ''],
	[new Date(2021, 11, 31, 3, 41, 44), 1, 'Event Duration: 2h 14m 57s\nMax Val: XYZ °C\nStart Time: 03:41:44\nEnd Time: 05:56:41'],

	[new Date(2021, 11, 31, 5, 56, 41), 1, 'Event Duration: 2h 14m 57s\nMax Val: XYZ °C\nStart Time: 03:41:44\nEnd Time: 05:56:41'],
	[new Date(2021, 11, 31, 5, 56, 41), 0, ''],

	[new Date(2021, 11, 31, 9, 40, 48), 0, ''],
	[new Date(2021, 11, 31, 9, 40, 48), 1, 'Event Duration: 2h 30m 17s\nMax Val: XYZ °C\nStart Time: 09:40:48\nEnd Time: 12:11:05'],

	[new Date(2021, 11, 31, 12, 11, 5), 1, 'Event Duration: 2h 30m 17s\nMax Val: XYZ °C\nStart Time: 09:40:48\nEnd Time: 12:11:05'],
	[new Date(2021, 11, 31, 12, 11, 5), 0, ''],

	[new Date(2021, 11, 31, 12, 45, 57), 0, ''],
	[new Date(2021, 11, 31, 12, 45, 57), 1, 'Event Duration: 2h 28m 9s\nMax Val: XYZ °C\nStart Time: 12:45:57\nEnd Time: 15:14:06'],

	[new Date(2021, 11, 31, 15, 14, 6), 1, 'Event Duration: 2h 28m 9s\nMax Val: XYZ °C\nStart Time: 12:45:57\nEnd Time: 15:14:06'],
	[new Date(2021, 11, 31, 15, 14, 6), 0, ''],

	[new Date(2022, 0, 1, 0, 0, 0), 0, '']
]);   //End data.addRows([])

var options = {
	title:'Generated 3 Events\nAverage Event Duration: 2h 24m 27s\nline 3',
	tooltip: {textStyle: {fontName: 'Lucida Console', fontSize: 12} },
	width: 1100,
	height: 500,
	lineWidth: 1,
	chartArea:{width: 900, height:150 },
	series: { 0: { color: '#188785', areaOpacity: 1.0}},
	legend: {position: 'none'},
	enableInteractivity: true,

	hAxis: {
		title: 'Date \& Time',
		titleTextStyle: {bold: false, italic: false},
		format: 'dd/MM/yyyy HH:mm',
		slantedText:true,
		slantedTextAngle:90,
		gridlines: {color: 'none'},
		},  //End hAxis

	vAxis: {
		title: 'Events Triggered',
		titleTextStyle: {bold: false, italic: false},
		viewWindow: {min: 0, max: 1},
		ticks: [{ v: 0, f: 'Event Off'}, {v: 1, f: 'Event On'}],
		gridlines: { color: 'transparent' }
		},  //End vAxis

	explorer: {
		actions: ['dragToZoom', 'rightClickToReset'],
		axis: 'horizontal',
		keepInBounds: true,
		maxZoomIn: 20.0,
		},  //End explorer

	};  //End var options

var chart = new google.visualization.AreaChart(document.getElementById('chart_div'));

  // listen for chart ready event
  google.visualization.events.addListener(chart, 'ready', function () {
// get label copy to change
var labelContent = options.title.split('\n');

// get chart labels
var labels = chart.getContainer().getElementsByTagName('text');

// loop chart title lines, beginning with second line
for (var l = 1; l < labelContent.length; l++) {
  // find chart label
  for (var i = 0; i < labels.length; i++) {
    if (labels[i].textContent === labelContent[l]) {
      // reduce font size
      var currentFontSize = parseInt(labels[i].getAttribute('font-size'));
      labels[i].setAttribute('font-size', currentFontSize - 4);
      break;
    }
  }
}
  });

chart.draw(data, options);

}  //End drawChart()
<script type="text/javascript" src="https://www.gstatic.com/charts/loader.js"></script>
<div id="chart_div"></div>   
Gnosticize answered 10/12, 2019 at 22:58 Comment(1)
After you zoom in, you'll need to click "Run code snippet" again to make the title appear in the correct format...Gnosticize
P
2

since the chart does not register a "zoom" event,
we'll need to use a MutationObserver
which will let us know anytime the chart changes.

// listen for changes to the chart
var observer = new MutationObserver(setTitle);
observer.observe(chart.getContainer(), {
  childList: true,
  subtree: true
});

we'll create the MutationObserver during the 'ready' event.
after saving the original font size.

see following working snippet...

google.charts.load('current', {'packages':['corechart']})
google.charts.setOnLoadCallback(drawChart);

function drawChart() {
var data = new google.visualization.DataTable();
data.addColumn('date', 'Date \& Time');
data.addColumn('number', "Triggered Events");
data.addColumn({type: 'string', role: 'tooltip'});
data.addRows([
  [new Date(2021, 11, 31, 0, 0, 0), 0, ''],


  [new Date(2021, 11, 31, 3, 41, 44), 0, ''],
  [new Date(2021, 11, 31, 3, 41, 44), 1, 'Event Duration: 2h 14m 57s\nMax Val: XYZ °C\nStart Time: 03:41:44\nEnd Time: 05:56:41'],

  [new Date(2021, 11, 31, 5, 56, 41), 1, 'Event Duration: 2h 14m 57s\nMax Val: XYZ °C\nStart Time: 03:41:44\nEnd Time: 05:56:41'],
  [new Date(2021, 11, 31, 5, 56, 41), 0, ''],

  [new Date(2021, 11, 31, 9, 40, 48), 0, ''],
  [new Date(2021, 11, 31, 9, 40, 48), 1, 'Event Duration: 2h 30m 17s\nMax Val: XYZ °C\nStart Time: 09:40:48\nEnd Time: 12:11:05'],

  [new Date(2021, 11, 31, 12, 11, 5), 1, 'Event Duration: 2h 30m 17s\nMax Val: XYZ °C\nStart Time: 09:40:48\nEnd Time: 12:11:05'],
  [new Date(2021, 11, 31, 12, 11, 5), 0, ''],

  [new Date(2021, 11, 31, 12, 45, 57), 0, ''],
  [new Date(2021, 11, 31, 12, 45, 57), 1, 'Event Duration: 2h 28m 9s\nMax Val: XYZ °C\nStart Time: 12:45:57\nEnd Time: 15:14:06'],

  [new Date(2021, 11, 31, 15, 14, 6), 1, 'Event Duration: 2h 28m 9s\nMax Val: XYZ °C\nStart Time: 12:45:57\nEnd Time: 15:14:06'],
  [new Date(2021, 11, 31, 15, 14, 6), 0, ''],

  [new Date(2022, 0, 1, 0, 0, 0), 0, '']
]);   //End data.addRows([])

var options = {
  title:'Generated 3 Events\nAverage Event Duration: 2h 24m 27s\nline 3',
  tooltip: {textStyle: {fontName: 'Lucida Console', fontSize: 12} },
  width: 1100,
  height: 500,
  lineWidth: 1,
  chartArea:{width: 900, height:150 },
  series: { 0: { color: '#188785', areaOpacity: 1.0}},
  legend: {position: 'none'},
  enableInteractivity: true,

  hAxis: {
    title: 'Date \& Time',
    titleTextStyle: {bold: false, italic: false},
    format: 'dd/MM/yyyy HH:mm',
    slantedText:true,
    slantedTextAngle:90,
    gridlines: {color: 'none'},
    },  //End hAxis

  vAxis: {
    title: 'Events Triggered',
    titleTextStyle: {bold: false, italic: false},
    viewWindow: {min: 0, max: 1},
    ticks: [{ v: 0, f: 'Event Off'}, {v: 1, f: 'Event On'}],
    gridlines: { color: 'transparent' }
    },  //End vAxis

  explorer: {
    actions: ['dragToZoom', 'rightClickToReset'],
    axis: 'horizontal',
    keepInBounds: true,
    maxZoomIn: 20.0,
    },  //End explorer

  };  //End var options

var chart = new google.visualization.AreaChart(document.getElementById('chart_div'));

var origFontSize;

// listen for chart events
google.visualization.events.addListener(chart, 'ready', function () {
  // save font size of chart label
  var labels = chart.getContainer().getElementsByTagName('text');
  origFontSize = parseInt(labels[0].getAttribute('font-size')) - 4;
  setTitle();

  // listen for changes to the chart
  var observer = new MutationObserver(setTitle);
  observer.observe(chart.getContainer(), {
    childList: true,
    subtree: true
  });
});

function setTitle() {
  // get label copy to change
  var labelContent = options.title.split('\n');

  // get chart labels
  var labels = chart.getContainer().getElementsByTagName('text');

  // loop chart title lines, beginning with second line
  for (var l = 1; l < labelContent.length; l++) {
    // find chart label
    for (var i = 0; i < labels.length; i++) {
      if (labels[i].textContent === labelContent[l]) {
        // reduce font size
        labels[i].setAttribute('font-size', origFontSize);
        break;
      }
    }
  }
}

chart.draw(data, options);

}  //End drawChart()
<script type="text/javascript" src="https://www.gstatic.com/charts/loader.js"></script>
<div id="chart_div"></div>
Pyroelectricity answered 10/12, 2019 at 23:30 Comment(8)
In one word - wow; in two - mind blown. Thank you!! <3 Also, how do you know all this, is it through experience, or is there a book you could recommend?Gnosticize
@Gnosticize I believe I have the most relevant sources concerning gVis and it pales in comparison to WhiteHat's answers, just bookmark his profileRib
@Pyroelectricity sorry, I was just in a state of awe and forgot!Gnosticize
no worries, thanks!! please let me know if I can help with anything...Pyroelectricity
@Pyroelectricity - :) I hope you wouldn't be cross with me, if I had just one more question?Gnosticize
of course not, but that question has my head spinning. if it weren't for the intervals, adding the rows with different lengths wouldn't be a problem. we need the rows with lesser values to be shifted to the end, next to the interval columns. for instance, on Tuesday, after running through getBoxPlotValues, you have the original values, followed by three nulls, then the box plot values. we need the nulls to swap places with the original values. at least i think. I'll try again later...Pyroelectricity
@Pyroelectricity I've done a bunch of reading yesterday and couldn't find a way, so I've edited the question - I think it's relatively easier now...Gnosticize
@Pyroelectricity - I just have one very very last question (I promise) very similar to this but for some reason I can't seem to get my head around this.Gnosticize

© 2022 - 2024 — McMap. All rights reserved.