Find out whether Chrome console is open
Asked Answered
I

23

202

I am using this little script to find out whether Firebug is open:

if (window.console && window.console.firebug) {
    //is open
};

And it works well. Now I was searching for half an hour to find a way to detect whether Google Chrome's built-in web developer console is open, but I couldn't find any hint.

This:

if (window.console && window.console.chrome) {
    //is open
};

doesn't work.

EDIT:

So it seems that it is not possible to detect whether the Chrome console is open. But there is a "hack" that works, with some drawbacks:

  • will not work when console is undocked
  • will not work when console is open on page load

So, I am gonna choose Unsigned´s answer for now, but if some1 comes up with a brilliant idea, he is welcome to still answer and I change the selected answer! Thanks!

Issuant answered 17/10, 2011 at 19:47 Comment(8)
The solution in the answer seems to work, however only if the console is docked. Also it doesn't work if the console is already open on page load, while the Firebug script does not have this problems and seems to always work. But I can live with that for now! Thanks a lot @pimvdb!! I will keep the question open anyways to maybe find a way similar to the Firebug script, that always works.Issuant
I've been trying things like throwing an error and see whether .message is fetched (which happens when the debugger is open because you see the message), but unfortunately this also happens when the debugger is not opened. I'd like to know a hack for this if it exists...Herdic
The question is why do you need to do this? If you're trying to prevent debugging, there are other debugging tools which can be used instead.Wrath
@Wrath It is not relevant to the question why I need it and I dont want to start explaining. I do know there is no way to prevent some1 from debugging, but thats not what I am trying to do. I am just trying to figure out a way to know if the console is open or not. Thats all :)Issuant
JFYI console.profiles method was removed from console API recently src.chromium.org/viewvc/blink?view=revision&revision=151136Caribou
You can check collabland.la When you open the developer tool in chrome, it is automatically going into debugging mode which means it detects the chrome console is opened. And if could, I want an explanation of why this happens and how to do or protect it.Josephus
While I understand that people want to detect if the console was opened, I really hate it and I think all web browser vendors should work harder to remove any possibility to exploit this. This is abused on some websites. Someone who really wants to get certain information will always be able to do it.Chloro
@Chloro I'm not sure how it's going to get better. I agree that often this is used for annoying and/or nefarious purposes. especially debugger-statement-based approaches like mine. but there are still user workarounds like disabling breakpoints. and yes, I agree that this is a weak protection against client-side snooping (see this post of mine, for example).Lakendra
M
144

Leaving previous answers below for historical context.

Debugger (2022)

While not fool-proof, this debugger-based approach in another answer does appear to still work.

requestAnimationFrame (Late 2019)

Currently Muhammad Umer's approach works on Chrome 78, with the added advantage of detecting both close and open events.

function toString (2019)

Credit to Overcl9ck's comment on this answer. Replacing the regex /./ with an empty function object still works.

var devtools = function() {};
devtools.toString = function() {
  if (!this.opened) {
    alert("Opened");
  }
  this.opened = true;
}

console.log('%c', devtools);
// devtools.opened will become true if/when the console is opened

regex toString (2017-2018)

Since the original asker doesn't seem to be around anymore and this is still the accepted answer, adding this solution for visibility. Credit goes to Antonin Hildebrand's comment on zswang's answer. This solution takes advantage of the fact that toString() is not called on logged objects unless the console is open.

var devtools = /./;
devtools.toString = function() {
  if (!this.opened) {
    alert("Opened");
  }
  this.opened = true;
}

console.log('%c', devtools);
// devtools.opened will become true if/when the console is opened

console.profiles (2013)

Update: console.profiles has been removed from Chrome. This solution no longer works.

Thanks to Paul Irish for pointing out this solution from Discover DevTools, using the profiler:

function isInspectOpen() {
  console.profile();
  console.profileEnd();
  if (console.clear) {
    console.clear();
  }
  return console.profiles.length > 0;
}
function showIfInspectIsOpen() {
  alert(isInspectOpen());
}
<button onClick="showIfInspectIsOpen()">Is it open?</button>

window.innerHeight (2011)

This other option can detect the docked inspector being opened, after the page loads, but will not be able to detect an undocked inspector, or if the inspector was already open on page load. There is also some potential for false positives.

window.onresize = function() {
  if ((window.outerHeight - window.innerHeight) > 100) {
    alert('Docked inspector was opened');
  }
}
Microeconomics answered 18/10, 2011 at 15:2 Comment(18)
To Unsigned: are you absolutely sure there is no way to detect it? but what about detecting it when its docked BUT open on page load(the "hacky" way doesnt work there too)?Issuant
@Andrej: You are correct, I was actually just testing that myself before posting it. If the inspector is already open on page load, that script will not be able to detect it. You may also get false positives when working with certain framesets.Microeconomics
@Unsigned: Alright, I will keep the question open just in case some1 comes up with something amazingly brilliant :) Otherwise I am gonna mark your answer tomorrow. I hope thats fine with you :)Issuant
You can make this technique slightly less obtrusive by using a collapsed console group to hide the messages that are generated by running the profiler. See github.com/adamschwartz/chrome-inspector-detectorPlimsoll
JFYI console.profiles method was removed from console API recently src.chromium.org/viewvc/blink?view=revision&revision=151136Caribou
This will cease to work soon in Chrome: codereview.chromium.org/15816002 (Sorry, y'all)Parasol
Getting TypeError: Cannot read property 'length' of undefined in isInspectOpen()Mb
FYI, 100 is an unknown value of the actual browser window's height - the document window's height as outerHeight is the height of the whole browser window. So, in chrome's case, 100 is the header's height.Tasiatasiana
This not correctly, when i resize browser (not open developer tools) alert still show.Bonilla
@NguyễnHuy "There is also some potential for false positives."Microeconomics
There's a new new best way (credits: @zswang): #7799248Embryogeny
THERE IS A WAY TO DETECT NO MATTER WHAT!! You need to call the same function for window.resize (in the update code in this answer) when the page loads.Stroke
FWIW you should put the date next to your update edit title. Hard to know which order updates are in at first glance.Appliance
@Appliance I've added at least the year for all three answers. Hope that helps make the ordering more obvious.Microeconomics
the solution of 'toString (2017)' does not work in chromePagination
toString seem to have been fixed in chrome. Edit. Actually it works if you use a function() {} instead of a regexCrap
@Crap your solution was working until the latest Chrome 77 update. Can you point us in the right direction for a workaround?Endocrinotherapy
Confirmed with Chrome v80.0.3987.149 - still not working.Overtrump
C
127

Chrome 65+ (2018)

    r = /./
    r.toString = function () {
        document.title = '1'
    }
    console.log('%c', r);

demo: https://jsbin.com/cecuzeb/edit?output (Update at 2018-03-16)

package: https://github.com/zswang/jdetects


When printing “Element” Chrome developer tools will get its id

    var checkStatus;
    
    var element = document.createElement('any');
    element.__defineGetter__('id', function() {
        checkStatus = 'on';
    });
    
    setInterval(function() {
        checkStatus = 'off';
        console.log(element);
        console.clear();
    }, 1000);

Another version (from comments)

var element = new Image();
Object.defineProperty(element, 'id', {
  get: function () {
    /* TODO */
    alert('囧');
  }
});
console.log('%cHello', element);

Print a regular variable:

    var r = /./;
    r.toString = function() {
      document.title = 'on';
    };
    console.log(r);
Commiserate answered 4/6, 2015 at 8:2 Comment(10)
Great answer. One thing to add...MDN says __defineGetter__ is deprecated so I changed to Object.defineProperty(element, 'id', {get:function() {checkStatus='on';}});...still working.Investigation
You can also avoid clearing the console every second by going throwing an error in the setter. Chrome will collapse like errors by default. jsfiddle.net/gcdfs3ooSpirograph
Also the console will 'read' the element as soon as the console opens, so you could just print once and just wait for the function in the getter to execute instead of setting an setIntervalHuoh
Based on this discovery I was able to find less-intrusive method. DevTools calls toString() on functions when printing them to console. So one can print a custom function object with toString() method override returning empty string. Additionally you could use console formatting string %c and set color:transparent to make sure potentially printed text prints as invisible. I used this technique here: github.com/binaryage/cljs-devtools/blob/…Academe
Year 2017 here. Chrome still writes things to console without you opening it. And your hack don't work anymore.Intended
Here is another one where the dev console doesn't get spammed (if default logging is set) and doesn't clear the timeout: https://jsfiddle.net/vic10us/w5tjzvcw/Stylobate
Tested on firefox doesn't work with Inspection Element(Q) and Inspect Element with firebugAerobiosis
the first example in Chromium 63 still work, but the toString with regex or function don'tZared
Chrome canary now prevents the first method from working (github.com/zswang/jdetects/issues/3)Screenplay
For anyone looking to bypass this on annoying websites, just debug a script, and before it loads run this in dev console: Image = null;Thermosiphon
C
51

Very Reliable hack

Basically set a getter on property and log it in console. Apparently the thing gets accessed only when console is open.

https://jsfiddle.net/gcdfs3oo/44/

var checkStatus;
var indicator = document.querySelector('#devtool-status');

var element = new Image();
Object.defineProperty(element, 'id', {
  get: function() {
    checkStatus='on';
    throw new Error("Dev tools checker");
  }
});

requestAnimationFrame(function check() {
  checkStatus = 'off';
  console.dir(element);
  indicator.className  = checkStatus;
  requestAnimationFrame(check);
});
.on{
  color:limegreen;
}

.off{
  color:red;
}
<link rel="stylesheet" href="https://cdnjs.cloudflare.com/ajax/libs/font-awesome/5.7.1/css/all.css" integrity="sha256-DVK12s61Wqwmj3XI0zZ9MFFmnNH8puF/eRHTB4ftKwk=" crossorigin="anonymous" />

<p>
  <ul>
    <li>
      dev toolbar open: icon is <span class="on">green</span>
    </li>
    <li>
      dev toolbar closed: icon is <span class="off">red</span>
    </li>
  </ul>
</p>
<div id="devtool-status"><i class="fas fa-7x fa-power-off"></i></div>
<br/>
<p><b>Now press F12 to see if this works for your browser!</b></p>
Cerise answered 16/1, 2018 at 18:27 Comment(10)
Chrome version 79 ✅Golub
What's the throw new Error("Dev tools checker"); for? Because it works without it.Golub
this appears to spam the console (when open)? which I assume will start to eat significant amounts of memory after a few days :)Anoa
Ingenious! This method can be subverted with something like console.log = function() {} and console.dir = function() {}.Roper
Is it possible to redirect page if Inspect Element Opens. Please tell if Possible. Thank YouCecil
Chrome Canary 89.0.4373.0 no longer works ❎Staves
would this mean chrome will intentionally patch this in the future or is this just something broken with canaryMousetail
@Golub if you try to access element.id yourself in your code it will throw an error so that you know you're using this wrong. console.log(element.id) will not work because you're accessing id yourself and the goal is get the console to access that property. console.dir will automatically access all properties of the argument it was supplied and it will suppress/ignore that error. That's why this is a clever hack because it's forcing the console to do the property access. Now if we could only figure out a way to not spam the consoleHowells
This no longer works in chrome 90 (stable)Stevens
Doesn't work in FF 90 either. Horrible performance while using this too, only spews out content into the consoleGaudery
O
29

I created devtools-detect which detects when DevTools is open:

console.log('is DevTools open?', window.devtools.open);

You can also listen to an event:

window.addEventListener('devtoolschange', function (e) {
    console.log('is DevTools open?', e.detail.open);
});

It doesn't work when DevTools is undocked. However, works with the Chrome/Safari/Firefox DevTools and Firebug.

Oxime answered 8/10, 2013 at 19:49 Comment(2)
@barbushin I think your open devtool docked, it can't detect separate window.Weimer
Sadly it stopped working for Chrome github.com/sindresorhus/devtools-detect/issues/40Protrusile
B
22
console.log(Object.defineProperties(new Error, {
  message: {get() {alert('Chrome/Firefox')}},
  toString: {value() {(new Error).stack.includes('toString@')&&alert('Safari')}}
}));

Demo: https://jsbin.com/cateqeyono/edit?html,output

Bandore answered 8/4, 2022 at 8:47 Comment(4)
Nice find! Is there any way to get this to re-spingload itself after the console is closed / to make it poll without firing repeatedly while the console is open? One approach could be to have a high-frequency setTimeout that updates a timestamp each time it fires, and then only executes the callback (which here is alert()) if the previous timestamp value is undefined or sufficiently close to the current time. The timestamp could be made private via an IIFE. The downside of the setTimeout would be the console spam.Lakendra
not working while device toolbar is toggled on (chrome)Ledezma
@Ledezma what steps to reproduce? When I make a basic html file with this in a <script>, open the page with devtools closed, then open devtools having already set devtools before to keep device toolbar open, it works for me.Lakendra
@starball open the page with devtools closed > open devtools > device toolbar on (375px) > close devtools with device toolbar is toggled on > reload the page > then OPEN devtools.Ledezma
C
19

------ Update: ------

This is an old question with many great answers that worked for a while. The current best answer as of September 5th 2022 is by @starball https://mcmap.net/q/47106/-find-out-whether-chrome-console-is-open

Btw, my answer is still working the same since I've posted it, it's just a bit difficult to make it always accurate. Click on the "Manual Benchmark" link in my demo with the console closed/opened to see what I mean - there is always a big difference.

----------------------

I found a way to tell if the Chrome Console is opened or not. It’s still a hack but it’s way more accurate and will work whether the console is undocked or not.

Basically running this code with the console closed takes about ~100 microseconds and while the console is opened it takes about twice as much ~200 microseconds.

console.log(1);
console.clear();

(1 millisecond = 1000 microsecond)

I’ve written more about it here.

Demo is here.

Crochet answered 20/6, 2014 at 12:17 Comment(3)
It is very wrong solution. Google it -> "Race Hazard". Slower or faster computer and...?Epode
"Race Hazard" is not related here. There is always a relative slowness when the console is opened.Crochet
Relative slowness but not always 100 or 200ms. Thus Race Hazard. Btw. If you will play a game in the same time, this "solution" will return false positive result.Epode
L
15

There seem to be a few common classes of solutions:

  • Rely on detecting resizing of the screen when the devtools appear (this doesn't work when the devtools/console are opened as a separate window)
  • Intercept certain user actions that can bring up the devtools/console such as right click menu, F12, Ctrl+Shift+C, etc. This can't cover UI mechanisms that are in the browser chrome that aren't detectable by the page.
  • Log something to the console and rely on browser-specific behaviour for lazy, fancy printing. Historically, these seem to not be highly reliable, but they're nice and simple. If you want them to work repeatedly in the same browsing session, you'll probably have to accept some degree of console spam.
  • Use timing heuristics with the debugger statement. The tricky part is to find a way so that the timers can't get messed up by long running tasks in the event loop queue, and the fact that the debugger statement pauses execution of the thread it runs on. There's also the challenge that regular debugger statements can be disabled by the user on a case-by-case or disable-all basis.

What follows is my solution to the specific problems with the debugger approach. Ie. Avoid false positives when the main thread runs a long task between a heuristic timer, avoid the debugger statement from blocking the main thread, and prevent disabling the debugger statement. Note: I don't think there is a way to prevent a user from disabling all debugger breakpoints, and that is probably for the best.

How It Works

The Chrome browser enters debugging when devtools are open and a thread encounters a debugging statement.

  1. Main thread sends a message to a webworker thread.
  2. Worker thread replies with an opening heartbeat.
  3. Main thread reacts by starting a timer to expect the closing heartbeat.
  4. Worker thread's message handler encounters a debugger statement (optionally wrapped in an eval statement to prevent the user from disabling it).
  5. If devtools are closed, the worker will immediately send an acknowledgement to the main thread, and the main thread will conclude that devtools are closed.
  6. If devtools are opened, the worker will enter a debugging session, and the main thread will notice that the Worker has not responded sufficiently quickly, concluding that the debugger must be open. The main thread will not be blocked by the worker's debugging session, but it's timeout response will be blocked by any heavy processing in the main thread ahead of it in the event queue.

I've published a reference implementation (authored by me) here on GitHub, and a demo here.

Pros

  • Unlike screen-size-change-detection approaches, this works when the console is in a separate window.
  • Unlike user-action-interception approaches, this works regardless of what user action brings up the console.
  • Unlike console.log approaches, this can work for multiple open-closes of the console without spamming the console with messages.
  • Unlike basic timer-debugger approaches, the detection should never trigger false positives due to busy threads (main thread, or other workers), the debugger statement is in the worker instead of the main thread, so the main thread won't get blocked, and the eval-debugger statement prevents disabling that specific debugger statement.

Cons

  • The user can disable all breakpoints, which will disable this method of detection.
  • The eval-wrapped debugger statement won't work on sites which disable eval via their Content Security Policy, in which case only a regular debugger statement can be used.
Lakendra answered 23/7, 2021 at 6:19 Comment(0)
V
8

I found new methods work at Chrome 89

Using console.profile, setInterval and function toString

    var devtools = function() {};
    devtools.toString = function() {
        alert('NOPE!!')
        return '-'
    }

    setInterval(()=>{
        console.profile(devtools)
        console.profileEnd(devtools)
    }, 1000)

In safari, it doesn't works.

Below chrome 89, i can't check whether it works.

Viewpoint answered 18/4, 2021 at 13:5 Comment(4)
This solution doesn't work for Chrome versions below about 70. However those versions are too outdated, am I right? This solution is neat. Why no one talks about it?Naught
This is the current best solution for Chrome > 89. Question : Could it be triggered by any false positive ?Hanker
This no longer works for me on Chrome 99.0.4844.51.Feeley
it still works with 99.0.4844.51 but it generates a ton of false positive too, if you don't mind, it will still be triggerdHanker
D
4

The Chrome developer tools is really just a part of WebKit's WebCore library. So this question applies to Safari, Chrome, and any other WebCore consumers.

If a solution exists, it'll be based off a difference in the DOM when the WebKit web inspector is open and when it's closed. Unfortunately, this is a kind of a chicken and egg problem because we can't use the inspector to observe the DOM when the inspector is closed.

What you may be able to do is write a bit of JavaScript to dump the entire DOM tree. Then run it once when the inspector is open, and once when the inspector is closed. Any difference in the DOM is probably a side-effect of the web inspector, and we may be able to use it to test if the user is inspecting or not.

This link is a good start for a DOM dumping script , but you'll want to dump the entire DOMWindow object, not just document.

Update:

Looks like there's a way to do this now. Check out Chrome Inspector Detector

Dymphia answered 18/10, 2011 at 21:57 Comment(2)
Chrome Inspector Detector no longer works for google chrome as mentioned by the developerOrin
not only what @Orin wrote, but also, you're partially right observing different browsers, yet saying that "we can't use the inspector to observe the DOM when the inspector is closed" => Well you can, you can send an XMLHttpRequest to a webservice that would load a boolean detecting if inspector open/closed, and also closed would send the response, independent of your client console being unattainable.Tova
E
4

I wrote a blog post about this: http://nepjua.org/check-if-browser-console-is-open/

It can detect whether it's docked or undocked

function isConsoleOpen() {  
  var startTime = new Date();
  debugger;
  var endTime = new Date();

  return endTime - startTime > 100;
}

$(function() {
  $(window).resize(function() {
    if(isConsoleOpen()) {
        alert("You're one sneaky dude, aren't you ?")
    }
  });
});
Evania answered 6/12, 2014 at 23:51 Comment(3)
That's nice, but, it'll stale the page and no message will be shown until the user will click the resume button. It'll be highly intrusive for the user.Crochet
Next "Race Hazard" solution. Very wrong. BTW. "debugger" command can be disabled.Epode
I've created a similar solution https://mcmap.net/q/47106/-find-out-whether-chrome-console-is-open that doesn't block the main thread. Limitations are listed in the repo readme. Also, I noticed that Chrome 91 (and maybe others) "forget" the setting of "disable all breakpoints" upon closing devtools, which can be good or bad depending on what you want, but I think to most people here it will be good.Lakendra
S
3

There is a tricky way to check it for extensions with 'tabs' permission:

chrome.tabs.query({url:'chrome-devtools://*/*'}, function(tabs){
    if (tabs.length > 0){
        //devtools is open
    }
});

Also you can check if it open for your page:

chrome.tabs.query({
    url: 'chrome-devtools://*/*',
    title: '*example.com/your/page*'
}, function(tabs){ ... })
Sanderling answered 6/8, 2014 at 8:31 Comment(0)
M
2

Muhammad Umer's approach worked for me, and I'm using React, so I decided to make a hooks solution:

const useConsoleOpen = () => {
  const [consoleOpen, setConsoleOpen] = useState(true)

  useEffect(() => {
    var checkStatus;

    var element = new Image();
    Object.defineProperty(element, "id", {
      get: function () {
        checkStatus = true;
        throw new Error("Dev tools checker");
      },
    });

    requestAnimationFrame(function check() {
      checkStatus = false;
      console.dir(element); //Don't delete this line!
      setConsoleOpen(checkStatus)
      requestAnimationFrame(check);
    });
  }, []);

  return consoleOpen
}

NOTE: When I was messing with it, it didn't work for the longest time and I couldn't figure out why. I had deleted console.dir(element); which is critical to how it works. I delete most non-descriptive console actions since they just take up space and aren't usually necessary to the function, so that was why it wasn't working for me.

To use it:

import React from 'react'

const App = () => {
  const consoleOpen = useConsoleOpen()

  return (
    <div className="App">
      <h1>{"Console is " + (consoleOpen ? "Open" : "Closed")}</h1>
    </div>
  );
}

I hope this helps anyone using React. If anyone wants to expand on this, I would like to be able stop the infinite loop at some point (since I don't use this in every component) and to find a way to keep the console clean.

Martica answered 6/6, 2020 at 16:43 Comment(1)
Is it possible to redirect page if Inspect Element Opens. Please tell if Possible. Thank YouCecil
A
1
var div = document.createElement('div');
Object.defineProperty(div,'id',{get:function(){
    document.title = 'xxxxxx'
}});

setTimeout(()=>console.log(div),3000)

Alidis answered 26/7, 2018 at 7:22 Comment(1)
It didn't work. And the link to test online didn't work.Secor
N
1

Javascript Detect Developer Tools Console Opening

Working from 2/2/2022

  • Chrome Version 97 (Developer Tools Undocked/Docked/Keyboard shortcuts)
  • Edge Version 97 (Developer Tools Undocked/Docked/Keyboard shortcuts)
  • FireFox Version 96.0.03 (Developer Tools Undocked/Docked/Keyboard shortcuts)
  • Safari ?
  • FireBug Detection (Developer Tools)

// Prevent Right Click (Optional)
document.addEventListener('contextmenu', function(event) {
    event.preventDefault();
}, true); 

// DevTools Opened Script
function DevToolsOpened() {
    alert("Developer Tools Opened");
}

// Detect DevTools (Chrome/Edge)
// https://mcmap.net/q/47106/-find-out-whether-chrome-console-is-open (SeongJun)
var devtools = function() {};
devtools.toString = function() {
    DevToolsOpened();
    return '-';
}

setInterval(()=>{
    console.profile(devtools);
    console.profileEnd(devtools);
    if (console.clear) {
        console.clear();
    }
}, 1000);

// Detect DevTools (FireFox)
if (navigator.userAgent.toLowerCase().indexOf('firefox') > -1){
    // Detect Resize (Chrome/Firefox/Edge Works) but (Triggers on Zoom In Chrome and Zoom Out FireFox)
    window.onresize = function() {
        if ((window.outerHeight - window.innerHeight) > 100 || (window.outerWidth - window.innerWidth) > 100) {
            DevToolsOpened();
        }
    }
}

// Detect Fire Bug
if (window.console && window.console.firebug || console.assert(1) === '_firebugIgnore') {
    DevToolsOpened();
};

// Detect Key Shortcuts
// https://mcmap.net/q/47106/-find-out-whether-chrome-console-is-open (hlorand)
window.addEventListener('keydown', function(e) {
    if (
        // CMD + Alt + I (Chrome, Firefox, Safari)
        e.metaKey == true && e.altKey == true && e.keyCode == 73 ||
        // CMD + Alt + J (Chrome)
        e.metaKey == true && e.altKey == true && e.keyCode == 74 ||
        // CMD + Alt + C (Chrome)
        e.metaKey == true && e.altKey == true && e.keyCode == 67 ||
        // CMD + Shift + C (Chrome)
        e.metaKey == true && e.shiftKey == true && e.keyCode == 67 ||
        // Ctrl + Shift + I (Chrome, Firefox, Safari, Edge)
        e.ctrlKey == true && e.shiftKey == true && e.keyCode == 73 ||
        // Ctrl + Shift + J (Chrome, Edge)
        e.ctrlKey == true && e.shiftKey == true && e.keyCode == 74 ||
        // Ctrl + Shift + C (Chrome, Edge)
        e.ctrlKey == true && e.shiftKey == true && e.keyCode == 67 ||
        // F12 (Chome, Firefox, Edge)
        e.keyCode == 123 ||
        // CMD + Alt + U, Ctrl + U (View source: Chrome, Firefox, Safari, Edge)
        e.metaKey == true && e.altKey == true && e.keyCode == 85 ||
        e.ctrlKey == true && e.keyCode == 85
    ) {
        DevToolsOpened();
    }
});
Nuzzi answered 2/2, 2022 at 10:13 Comment(6)
i am using the chrome only version and i get a ton of false positive, but i don't know what is triggering them, do you have any ideas ?Hanker
why do you need the if (console.clear) {console.clear();} ? just to make the console clean or its a requirement ? I have noticed it work without but getting a lot of false positives either wayHanker
@Hanker yes that is correct. Just remove it if you would like to view any errorsNuzzi
Nice, but a false positive alert in Safari ;-)Phylloxera
stopped working on chrome 99.0.4844.51, generates false positiveHanker
FWIW, there's an easy way to bypass this. You can click on the address bar then hit a key combo (F12) to open Devtools and it won't detect that it's been opened. Tested this on Chromium Edge and FF.Signor
T
1

When a browser's DevTools is open, breakpoints marked by 'debugger;' will be attached as long as you don't deactivate breakpoints.

So here is the code to check if debugger is enabled:

let workerUrl = 'data:application/javascript;base64,' + btoa(`
self.addEventListener('message', (e) => {
  if(e.data==='hello'){
    self.postMessage('hello');
  }
  debugger;
  self.postMessage('');
});
`);
function checkIfDebuggerEnabled() {
  return new Promise((resolve) => {
    let fulfilled = false;
    let worker = new Worker(workerUrl);
    worker.onmessage = (e) => {
      let data = e.data;
      if (data === 'hello') {
        setTimeout(() => {
          if (!fulfilled) {
            resolve(true);
            worker.terminate();
          }
        }, 1);
      } else {
        fulfilled = true;
        resolve(false);
        worker.terminate();
      }
    };
    worker.postMessage('hello');
  });
}

checkIfDebuggerEnabled().then((result) => {
  if (result) {
    alert('browser DevTools is open');
  }else{
    alert('browser DevTools is not open, unless you have deactivated breakpoints');
  }
});

Note: if CSP is used then you need either to add worker-src 'unsafe-inline' to CSP policy or to move worker source code above to a CSP-allowed resource and change workerUrl to that resource.

Tegan answered 8/12, 2022 at 18:33 Comment(0)
S
0

Also you can try this: https://github.com/sindresorhus/devtools-detect

// check if it's open
console.log('is DevTools open?', window.devtools.open);
// check it's orientation, null if not open
console.log('and DevTools orientation?', window.devtools.orientation);

// get notified when it's opened/closed or orientation changes
window.addEventListener('devtoolschange', function (e) {
    console.log('is DevTools open?', e.detail.open);
    console.log('and DevTools orientation?', e.detail.orientation);
});
Sacrifice answered 16/5, 2017 at 10:58 Comment(3)
Does not work well. If a user is on a mobile device, then they turn their device 90 degrees, then the screen will resize.Gunstock
works on chrome and ff not ie or edge as of 4/5/2019Kelton
Cute, but all that code does is check the window size and the inside HTML size (to see if the side of the page has anything in there) - while most of the time "devtools" lives on the side of the page, it's not the only thing that does (e.g. false positives), and it doesn't always live there (e.g. false negatives): this code is not actually detecting devtools at all.Bandog
I
0

If you are developers who are doing stuff during development. Check out this Chrome extension. It helps you detect when Chrome Devtoos is opened or closed.

https://chrome.google.com/webstore/detail/devtools-status-detector/pmbbjdhohceladenbdjjoejcanjijoaa?authuser=1

This extension helps Javascript developers detect when Chrome Devtools is open or closed on current page. When Chrome Devtools closes/opens, the extension will raise a event named 'devtoolsStatusChanged' on window.document element.

This is example code:

 function addEventListener(el, eventName, handler) {
    if (el.addEventListener) {
        el.addEventListener(eventName, handler);
    } else {
        el.attachEvent('on' + eventName,
            function() {
                handler.call(el);
            });
    }
}


// Add an event listener.
addEventListener(document, 'devtoolsStatusChanged', function(e) {
    if (e.detail === 'OPENED') {
        // Your code when Devtools opens
    } else {
        // Your code when Devtools Closed
    }
});
Intended answered 19/7, 2017 at 10:41 Comment(0)
D
0

Some answers here will stop working in Chrome 65. Here's a timing attack alternative that works pretty reliably in Chrome, and is much harder to mitigate than the toString() method. Unfortunately it's not that reliable in Firefox.

addEventListener("load", () => {

var baseline_measurements = [];
var measurements = 20;
var warmup_runs = 3;

const status = document.documentElement.appendChild(document.createTextNode("DevTools are closed"));
const junk = document.documentElement.insertBefore(document.createElement("div"), document.body);
junk.style.display = "none";
const junk_filler = new Array(1000).join("junk");
const fill_junk = () => {
  var i = 10000;
  while (i--) {
    junk.appendChild(document.createTextNode(junk_filler));
  }
};
const measure = () => {
    if (measurements) {
    const baseline_start = performance.now();
    fill_junk();
    baseline_measurements.push(performance.now() - baseline_start);
    junk.textContent = "";
    measurements--;
    setTimeout(measure, 0);
  } else {
    baseline_measurements = baseline_measurements.slice(warmup_runs); // exclude unoptimized runs
    const baseline = baseline_measurements.reduce((sum, el) => sum + el, 0) / baseline_measurements.length;

    setInterval(() => {
      const start = performance.now();
      fill_junk();
      const time = performance.now() - start;
      // in actual usage you would also check document.hasFocus()
      // as background tabs are throttled and get false positives
      status.data = "DevTools are " + (time > 1.77 * baseline ? "open" : "closed");
      junk.textContent = "";
    }, 1000);
  }
};

setTimeout(measure, 300);

});
Disherison answered 7/1, 2018 at 8:27 Comment(0)
C
0

As for Chrome/77.0.3865.75 a version of 2019 not works. toString invokes immediately without Inspector opening.

const resultEl = document.getElementById('result')
const detector = function () {}

detector.toString = function () {
	resultEl.innerText = 'Triggered'
}

console.log('%c', detector)
<div id="result">Not detected</div>
Cuyp answered 17/9, 2019 at 17:30 Comment(1)
not works on chrome94Isoniazid
A
0

use this package isDevToolsOpened() function from the package dev-tools-monitor which works as expected in all browsers except for firefox.

Aeolipile answered 8/11, 2020 at 19:9 Comment(1)
Firefox is not supported. If it is not supported then we could have simply used: window.outerWidth - window.innerWidth > 100 || window.outerHeight - window.innerHeight > 100;Cheboksary
P
0

You can catch the event of opening the dev. tools by adding event listeners to the keyboard shortcuts with which it opens. This is not a "hack" and it works 100% of the time.

The only case it won't catch is when the user opens it manually with mouse. So it is a "partial solution" perhaps it is useful for somebody.

<script>
function devToolsOpened(e){
    alert("devtools opened");
    // uncomment to prevent opening dev.tools:
    // e.preventDefault();
}
window.addEventListener('keydown', function(e) {

    if (
        // CMD + Alt + I (Chrome, Firefox, Safari)
        e.metaKey == true && e.altKey == true && e.keyCode == 73 ||
        // CMD + Alt + J (Chrome)
        e.metaKey == true && e.altKey == true && e.keyCode == 74 ||
        // CMD + Alt + C (Chrome)
        e.metaKey == true && e.altKey == true && e.keyCode == 67 ||
        // CMD + Shift + C (Chrome)
        e.metaKey == true && e.shiftKey == true && e.keyCode == 67 ||
        // Ctrl + Shift + I (Chrome, Firefox, Safari, Edge)
        e.ctrlKey == true && e.shiftKey == true && e.keyCode == 73 ||
        // Ctrl + Shift + J (Chrome, Edge)
        e.ctrlKey == true && e.shiftKey == true && e.keyCode == 74 ||
        // Ctrl + Shift + C (Chrome, Edge)
        e.ctrlKey == true && e.shiftKey == true && e.keyCode == 67 ||
        // F12 (Chome, Firefox, Edge)
        e.keyCode == 123 ||
        // CMD + Alt + U, Ctrl + U (View source: Chrome, Firefox, Safari, Edge)
        e.metaKey == true && e.altKey == true && e.keyCode == 85 ||
        e.ctrlKey == true && e.keyCode == 85
        ){
            devToolsOpened(e);
    }
});
</script>

Keyboard shortcuts to open Developer Tools:

Pembrook answered 3/12, 2020 at 23:55 Comment(4)
There's an infinite amount of ways to open dev tools. For example, context menu. Disabling it will destroy accessibility. Another one is (for Chrome at least) the 3 dots on the upper right corner. If you click it, then click more tools, then you can also open developer tools.Kraft
@Kraft There are 3 ways to open devtools: With keyboard shortcuts, and with mouse: either with right click or with the browser menu you wrote. This code catches every keyboard shortcut opening method in major browsers - and does not disables it (it is only a commented out example of what you can do with it). There is no need to downwote my comment. This partial solution is useful for somebody, because it works every time - not like other hacky solutions.Pembrook
I did not downvote your solution. My guess is because it doesn't exactly answer the question.Kraft
This doesn't work 100% of the time. Clicking on the address bar and hitting F12 will cause this not detect DevTools opening.Signor
M
-1

Timing solution (works for docked and undocked)

It is a bit intrusive but not as much as the debugger trap

var opened = false;
var lastTime = Date.now();
const interval = 50;
const threshold = 30;
setInterval(() => {

    let delta = Date.now() - lastTime;

    if (delta > interval + threshold) {
        document.title = "P3nis";
        opened = true;
    }

    lastTime = Date.now();

    if (!opened) {
        debugger;
    }

}, interval)
Malnutrition answered 7/4, 2022 at 10:53 Comment(0)
S
-3

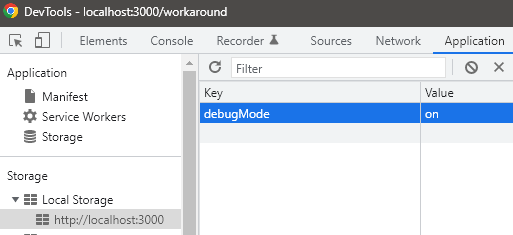
Best way to have Debug-Mode on/off feature is to set a flag 'debugMode'='off' in localStorage by default -

localStorage.setItem('debugMode', 'off');

Then, change it in Local Storage of browser manually to 'on' while development -

enter image description here

Then use below condition in code to do differrent action if it's 'on' -

if(localStorage.getItem('debugMode') === 'on'){
   //do something 1
}else {
   //do something 2
}

Septuor answered 12/5, 2022 at 3:33 Comment(1)
This doesn't help us in identifying whether console has been opened or not. That flag variable in localStorage will only help in identifying the environment.Tercentenary

© 2022 - 2024 — McMap. All rights reserved.