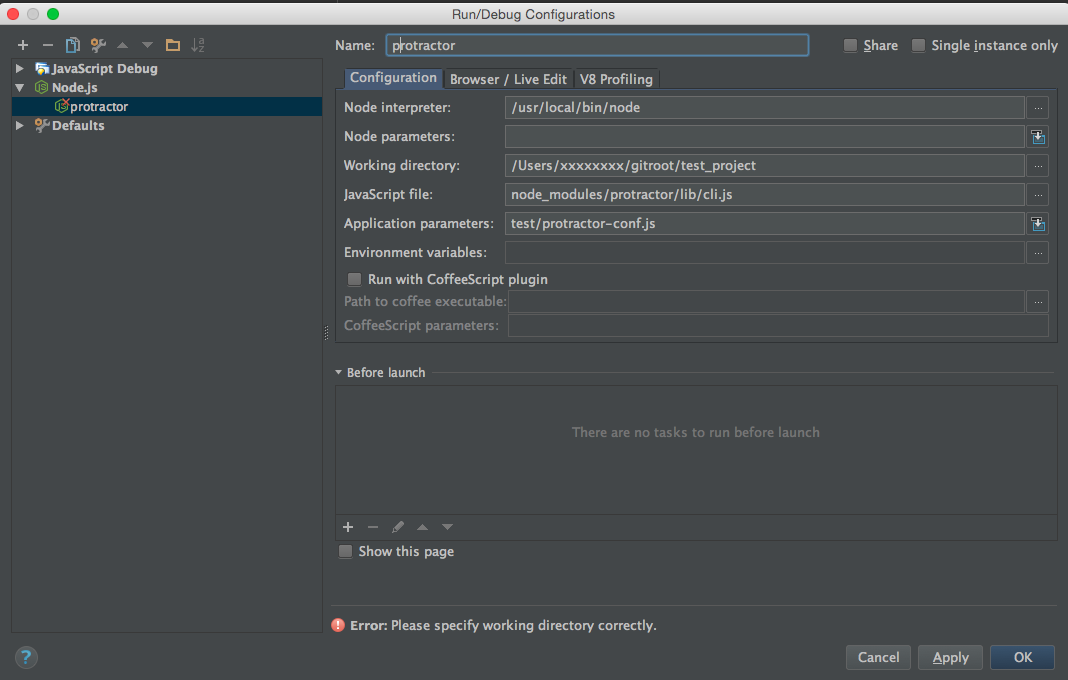
There is a way to run and debug protractor web-tests in WebStorm. I just want to share this answer here
- Get the node path (Type
which nodein your terminal) - In the WebStorm: Click on "Edit configurations" - the dropdown to the left of the "Run" button (green arrow like a "play" button)
- Click on the "Add button" (green +) to add a new Node configuration. Select "Node.js"
- Fill the params:
Node interpreter: Full path to Node.js (from step 1)
Working directory: home directory for the protractor tests.
Javascript file: Full path to node_modules/protractor/lib/cli.js
Application parameters: Full path to protractor-conf.js
Now you be able to run and debug tests by clicking on "Run" or "Debug" buttons on the top of IDE
I was experiencing the same problems described by comments to S.Panfilov's answer, i.e., running protractor in WebStorm worked fine, but the debugging process got stuck somewhere.
The issue is described here. It was occurring under Mac OS X with version 0.20.1 of protractor, and node v0.10.26.
The problem is solved in version 0.22.
- Update protractor to the latest version (>= 0.22) using npm
- Run again: node_modules/protractor/bin/webdriver-manager update
- In WebStorm configure 'Your Protractor Conf' as described by S.Panfilov in his answer
- Set breakpoints in your protractor test file (watch this video first)
- Launch "Run > Debug 'Your Protractor Conf'" from WebStorm
- Enjoy debugging
Worked for me. It was looking for the protractor.conf.js in the wrong folder. Had to look up a couple dirs.
Application parameters: ../../protractor.conf.js
Like some of the other responses here, I found that I could run in release but couldn't run in Debug and it would just hang at some point. I found that I had the conf file set to target two browsers and it seems that this was too much for the debugger and it would hang without any more info. Targeting only a single browser fixed this issue for me.
By the way if you need to pass additional parameters here is the configuration you need
- Select ‘Node.js’ configuration from the list
- Name: ‘Protractor’
- Node interpreter: ‘C:\Program Files\nodejs\node.exe’
- Node parameters: ‘’
- Working directory:
- JavaScript file: ‘~\AppData\Roaming\npm\node_modules\protractor\built\cli.js’
- Application parameters, this is where you specify path to your conf, relatively to working directory^ and then parameters like this: ‘e2e/settings/configs/protractor.custom.conf.js --baseUrl="https://stage.mysite.com" --params.login="testuser" --params.password="test_USER00"’
- Environment variables: ‘’
This config works great in my project, where we solely rely on async/await syntax
© 2022 - 2024 — McMap. All rights reserved.


