Construct adjacency matrix in MATLAB
Asked Answered
T

7

31

Consider a set of points arranged on a grid of size N-by-M. I am trying to build the adjacency matrix such that neighboring points are connected.

For example, in a 3x3 grid with a graph:

1-2-3
| | |
4-5-6
| | |
7-8-9

We should have the corresponding adjacency matrix:

+---+------------------------------------------------------+
|   |   1     2     3     4     5     6     7     8     9  |
+---+------------------------------------------------------+
| 1 |   0     1     0     1     0     0     0     0     0  |
| 2 |   1     0     1     0     1     0     0     0     0  |
| 3 |   0     1     0     0     0     1     0     0     0  |
| 4 |   1     0     0     0     1     0     1     0     0  |
| 5 |   0     1     0     1     0     1     0     1     0  |
| 6 |   0     0     1     0     1     0     0     0     1  |
| 7 |   0     0     0     1     0     0     0     1     0  |
| 8 |   0     0     0     0     1     0     1     0     1  |
| 9 |   0     0     0     0     0     1     0     1     0  |
+---+------------------------------------------------------+

As a bonus, the solution should work for both 4- and 8-connected neighboring points, that is:

   o             o  o  o
o  X  o   vs.    o  X  o
   o             o  o  o

This the code that I have so far:

N = 3; M = 3;
adj = zeros(N*M);

for i=1:N
    for j=1:M
        k = sub2ind([N M],i,j);
        if i>1
            ii=i-1; jj=j;
            adj(k,sub2ind([N M],ii,jj)) = 1; 
        end
        if i<N
            ii=i+1; jj=j;
            adj(k,sub2ind([N M],ii,jj)) = 1; 
        end
        if j>1
            ii=i; jj=j-1;
            adj(k,sub2ind([N M],ii,jj)) = 1; 
        end
        if j<M
            ii=i; jj=j+1;
            adj(k,sub2ind([N M],ii,jj)) = 1; 
        end
    end
end

How can this improved to avoid all the looping?

Taker answered 18/7, 2010 at 22:36 Comment(1)
no this is no homework. My ultimate goal is to plot these points and draw lines between connected points as a graph. The interesting thing is that these points don't have to stay located on the grid..Taker
T
24

If you notice, there is a distinct pattern to the adjacency matrices you are creating. Specifically, they are symmetric and banded. You can take advantage of this fact to easily create your matrices using the diag function (or the spdiags function if you want to make a sparse matrix). Here is how you can create the adjacency matrix for each case, using your sample matrix above as an example:

4-connected neighbors:

mat = [1 2 3; 4 5 6; 7 8 9];                 % Sample matrix
[r, c] = size(mat);                          % Get the matrix size
diagVec1 = repmat([ones(c-1, 1); 0], r, 1);  % Make the first diagonal vector
                                             %   (for horizontal connections)
diagVec1 = diagVec1(1:end-1);                % Remove the last value
diagVec2 = ones(c*(r-1), 1);                 % Make the second diagonal vector
                                             %   (for vertical connections)
adj = diag(diagVec1, 1)+diag(diagVec2, c);   % Add the diagonals to a zero matrix
adj = adj+adj.';                             % Add the matrix to a transposed copy of
                                             %   itself to make it symmetric

And you'll get the following matrix:

adj =

     0  1  0  1  0  0  0  0  0
     1  0  1  0  1  0  0  0  0
     0  1  0  0  0  1  0  0  0
     1  0  0  0  1  0  1  0  0
     0  1  0  1  0  1  0  1  0
     0  0  1  0  1  0  0  0  1
     0  0  0  1  0  0  0  1  0
     0  0  0  0  1  0  1  0  1
     0  0  0  0  0  1  0  1  0


8-connected neighbors:

mat = [1 2 3; 4 5 6; 7 8 9];                 % Sample matrix
[r, c] = size(mat);                          % Get the matrix size
diagVec1 = repmat([ones(c-1, 1); 0], r, 1);  % Make the first diagonal vector
                                             %   (for horizontal connections)
diagVec1 = diagVec1(1:end-1);                % Remove the last value
diagVec2 = [0; diagVec1(1:(c*(r-1)))];       % Make the second diagonal vector
                                             %   (for anti-diagonal connections)
diagVec3 = ones(c*(r-1), 1);                 % Make the third diagonal vector
                                             %   (for vertical connections)
diagVec4 = diagVec2(2:end-1);                % Make the fourth diagonal vector
                                             %   (for diagonal connections)
adj = diag(diagVec1, 1)+...                  % Add the diagonals to a zero matrix
      diag(diagVec2, c-1)+...
      diag(diagVec3, c)+...
      diag(diagVec4, c+1);
adj = adj+adj.';                             % Add the matrix to a transposed copy of
                                             %   itself to make it symmetric

And you'll get the following matrix:

adj =

     0  1  0  1  1  0  0  0  0
     1  0  1  1  1  1  0  0  0
     0  1  0  0  1  1  0  0  0
     1  1  0  0  1  0  1  1  0
     1  1  1  1  0  1  1  1  1
     0  1  1  0  1  0  0  1  1
     0  0  0  1  1  0  0  1  0
     0  0  0  1  1  1  1  0  1
     0  0  0  0  1  1  0  1  0
Tchao answered 19/7, 2010 at 18:6 Comment(1)
Can someone explain the logic behind this code? Thanks :)Chicalote
W
14

Just for fun, here's a solution to construct the adjacency matrix by computing the distance between all pairs of points on the grid (not the most efficient way obviously)

N = 3; M = 3;                  %# grid size
CONNECTED = 8;                 %# 4-/8- connected points

%# which distance function
if CONNECTED == 4,     distFunc = 'cityblock';
elseif CONNECTED == 8, distFunc = 'chebychev'; end

%# compute adjacency matrix
[X Y] = meshgrid(1:N,1:M);
X = X(:); Y = Y(:);
adj = squareform( pdist([X Y], distFunc) == 1 );

And here's some code to visualize the adjacency matrix and the graph of connected points:

%# plot adjacency matrix
subplot(121), spy(adj)

%# plot connected points on grid
[xx yy] = gplot(adj, [X Y]);
subplot(122), plot(xx, yy, 'ks-', 'MarkerFaceColor','r')
axis([0 N+1 0 M+1])
%# add labels
[X Y] = meshgrid(1:N,1:M);
X = reshape(X',[],1) + 0.1; Y = reshape(Y',[],1) + 0.1;
text(X, Y(end:-1:1), cellstr(num2str((1:N*M)')) )

8_connected 4_connected

Wells answered 19/7, 2010 at 19:36 Comment(0)
B
4

I just found this question when searching for the same problem. However, none of the provided solutions worked for me because of the problem size which required the use of sparse matrix types. Here is my solution which works on large scale instances:

function W = getAdjacencyMatrix(I)

[m, n] = size(I);

I_size = m*n;

% 1-off diagonal elements
V = repmat([ones(m-1,1); 0],n, 1);
V = V(1:end-1); % remove last zero

% n-off diagonal elements
U = ones(m*(n-1), 1);

% get the upper triangular part of the matrix
W = sparse(1:(I_size-1),    2:I_size, V, I_size, I_size)...
  + sparse(1:(I_size-m),(m+1):I_size, U, I_size, I_size);

% finally make W symmetric
W = W + W';
Biscay answered 10/10, 2013 at 11:49 Comment(0)
S
2

Just came across this question. I have a nice working m-function (link: sparse_adj_matrix.m) that is quite general.

It can handle 4-connect grid (radius 1 according to L1 norm), 8-connect grid (radius 1 according to L_infty norm).
It can also support 3D (and arbitrarily higher domensional grids).
The function can also connect nodes further than radius = 1.

Here's the signiture of the function:


% Construct sparse adjacency matrix (provides ii and jj indices into the
% matrix)
%
% Usage:
%   [ii jj] = sparse_adj_matrix(sz, r, p)
%
% inputs:
%   sz - grid size (determine the number of variables n=prod(sz), and the
%        geometry/dimensionality)
%   r  - the radius around each point for which edges are formed
%   p  - in what p-norm to measure the r-ball, can be 1,2 or 'inf'
%
% outputs
%   ii, jj - linear indices into adjacency matrix (for each pair (m,n)
%   there is also the pair (n,m))
%
% How to construct the adjacency matrix?
% >> A = sparse(ii, jj, ones(1,numel(ii)), prod(sz), prod(sz));
%
%
% Example:
% >> [ii jj] = sparse_adj_matrix([10 20], 1, inf);
% construct indices for 200x200 adjacency matrix for 8-connect graph over a
% grid of 10x20 nodes.
% To visualize the graph:
% >> [r c]=ndgrid(1:10,1:20);
% >> A = sparse(ii, jj, 1, 200, 200);;
% >> gplot(A, [r(:) c(:)]);
Scribble answered 10/10, 2013 at 12:9 Comment(3)
Shai, imagine I've a binary image (100x200) and I would like to obtain the valid 8-adjacencies only for the white pixels (foreground), i.e. in some cases some of the 8-neighbors of (i,j) are not valid since they might belong to background. I would like to obtain only the ones in the foreground. How could I build such an adjacency matrix using your sparse_adj_matrix script?Quinidine
An example of the binary image/ mask image is available in the following link: imgur.com/Wb432ScQuinidine
@Quinidine once you have the indices of the pairs ii and jj you can select (using logical indexing) only the indices that belongs to white pixels.Scribble
B
1

Your current code doesn't seem so bad. One way or another you need to iterate over all neighbor pairs. If you really need to optimize the code, I would suggest:

  • loop over node indices i, where 1 <= i <= (N*M)
  • don't use sub2ind() for efficiency, the neighbors of node i are simpy [i-M, i+1, i+M, i-1] in clockwise order

Notice that to get all neighbor pairs of nodes:

  • you only have to compute the "right" neighbors (i.e. horizontal edges) for nodes i % M != 0 (since Matlab isn't 0-based but 1-based)
  • you only have to compute "above" neighbors (i.e. vertical edges) for nodes i > M
  • there is a similar rule for diagonal edges

This would leed to a single loop (but same number of N*M iterations), doesn't call sub2ind(), and has only two if statements in the loop.

Boarish answered 19/7, 2010 at 3:24 Comment(1)
No problem. I see that jalexiou updated his post, the code he posted is IMHO the most readable and intuitive code of all the current posted solutions (although it can still be optimized a bit more). For instance Gnovice's solution exemplifies why i hate Matlab :p. O well, in Matlab it's probably more efficient. Good luck!Boarish
S
1

Well, as usual I'm late to the game, but what's a decade between friends? Plus this answer based on (play trumpets) RECURSION and generalizes the above question to arbitrary d-dimensional lattices of size N1 x N2 x ... x Nd. The solution is itself a generalization of the method used for hypercubes described in https://mcmap.net/q/471330/-generating-distanced-matrix-for-an-n-dimensional-hypercube I tend to write pedagogically, so don't hold it against me and please forgive the notation as this is one of the few SO's that doesn't support LaTeX. We'll first investigate a simple example and think about it with pictures. Then we'll turn those pictures into maths, and finally convert the maths into an algorithm. Ready?

Imagine a 4x3x2 lattice. How can we build it "from the ground up?" One way of doing so is to start with a 1d lattice: a graph with four vertices and 3 edges: A 1-dimensional lattice Cool, that was easy. Now let's extend this to a 2d lattice that is 4x3. We do so by making 3-1 copies of the 1d lattice, translate them, and then glue all the copies together into a 2d lattice: A 2-dimensional lattics I bet you can see where this is going. To finish we make 2-1 copies of our 2d lattice, and glue them together: A 3-dimensional lattice Ta da!

It should be clear that you can make a d-dimensional lattice with whatever size you want similarly. Now, how do we convert this pictorial process into maths? We'll need tools to copy and glue adjacency matrices together. Fortunately for us, all we need is the Kronecker product which has the awesome power to do both. AND it's been implemented in like every linear algebra library that's worth a damn.

Before showing you how to use the Kronecker product, we need to first understand the adjacency matrix of a 1d lattice of length N. That shouldn't be too hard: vertex 1 is only connected to vertex 2, vertex N is only connected to N-1, and every in between vertex k is connected to both k+1 and k-1. So the adjacency matrix reads: enter image description here Also, the identity matrix with N 1's on the diagonal is denoted 1(N), and given M(k-1) = N1 * N2 * ... * N(k-1).

Say you know the adjacency matrix of a N1 x N2 x ... x N(k-1) lattice, call it A(k-1). Then to make the adjacency matrix for the N1 x N2 x ... x N(k-1) x Nk lattice we first take Nk replicas of A(k-1). Then we take the same vertex in each replica, and glue them sequentially together with edges to form a 1d lattice. The resulting adjacency matrix has the form enter image description here If you're having trouble parsing the right hand side, the first term corresponds to the Nk copies of the (k-1)d lattice; that's all those diagonal terms in the middle matrix. Notice how all the 1(M(k-1))'s are in positions identical to what we just saw for the 1-d lattice: these are the edges that glue together the replicated vertices. And that's that, we have a recursive way of constructing a lattice. The base case is, of course, the 1d lattice.

Here's MATLAB implementation that you can translate into your favorite programming language. It takes as input a vector of positive integers, dims (the number of lattice points in each dimension), and spits out the adjacency matrix.

function L = LATTICE(dims)
  if length(dims) == 1
     L = sparse(eye(dims));
     L = circshift(L,1,1) + circshift(L,1,2);
     if dims > 2
        L(1,end) = 0; L(end,1) = 0;
     end
  else
     m = prod(dims(1:(end-1));
     L = kron(eye(dims(end)),LATTICE(dims(1:(end-1)) + ...
             kron(LATTICE(dims(end)),eye(m));
  end
end

Note the use of sparse matrices. You should use any analogous structure, just don't make a huge lattice and try to look at the full matrix, ok?

An example of using the above to make a 12 x 8 x 6 lattice is

L = LATTICE([12,8,6])

and plotting it

plot(graph(L),"Layout", "force3")

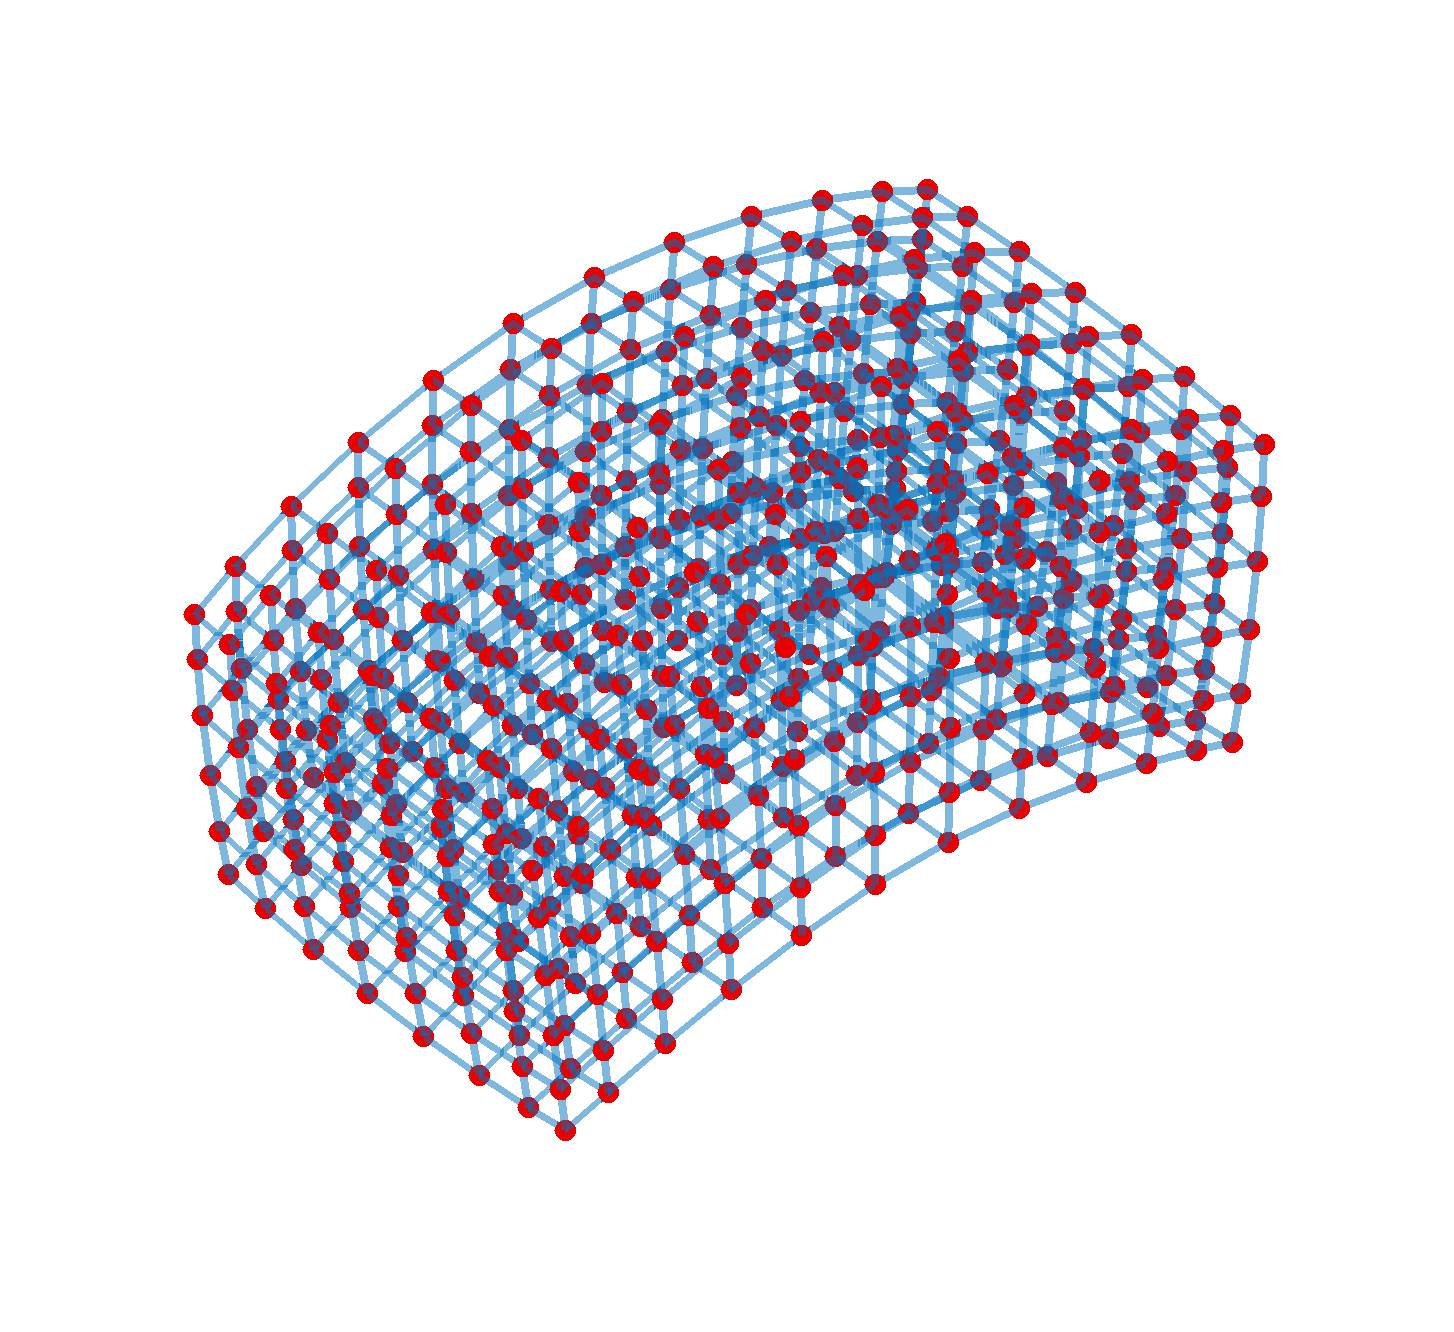
gives us this pretty beast: enter image description here (After some cosmetic tweaks, of course.)

Hopefully you found this response both useful and enjoyable to read. Cheers!

Syllabify answered 2/7 at 19:48 Comment(0)
R
0

For each node in the graph add a connection to the right and one downwards. Check that you don't overreach your grid. Consider the following function that builds the adjacency matrix.

function  adj = AdjMatrixLattice4( N, M )
    % Size of adjacency matrix
    MN = M*N;
    adj = zeros(MN,MN);

    % number nodes as such
    %  [1]---[2]-- .. --[M]
    %   |     |          |
    % [M+1]-[M+2]- .. -[2*M]
    %   :     :          :
    %   []    []   ..  [M*N]     

    for i=1:N
        for j=1:N
            A = M*(i-1)+j;          %Node # for (i,j) node
            if(j<N)                
                B = M*(i-1)+j+1;    %Node # for node to the right
                adj(A,B) = 1;
                adj(B,A) = 1;
            end
            if(i<M)
                B = M*i+j;          %Node # for node below
                adj(A,B) = 1;       
                adj(B,A) = 1;
            end            
        end
    end    
end

Example as above AdjMatrixLattice4(3,3)=

 0     1     0     1     0     0     0     0     0
 1     0     1     0     1     0     0     0     0
 0     1     0     0     0     1     0     0     0
 1     0     0     0     1     0     1     0     0
 0     1     0     1     0     1     0     1     0
 0     0     1     0     1     0     0     0     1
 0     0     0     1     0     0     0     1     0
 0     0     0     0     1     0     1     0     1
 0     0     0     0     0     1     0     1     0
Reames answered 19/7, 2010 at 1:53 Comment(3)
You are missing the point, I'm looking for a solution that will work for any values of N and M (grid size). I used 3x3 only as an example.Taker
I guess I missed that you wanted a fully connected graph. So now what is needed is a function to generate the connections vector based on a grid size. Actually two functions, one for the 4 connection scheme and one for the 8 connection scheme. See above for answer with 4 connections.Reames
The 8-node scenario is more complicated because you have to decide if the connections can cross each other or not.Reames

© 2022 - 2024 — McMap. All rights reserved.