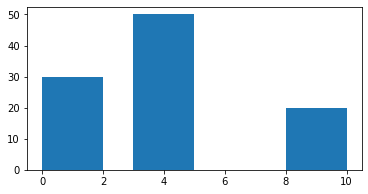
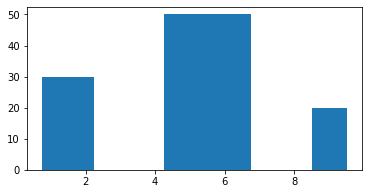
I'm making histograms using matplotlib's hist() function or bar(), and I want to use >10,000 bins (one bin to represent the counts at each coordinate of a large entity). Is there any way to create more whitespace between the vertical bars when I create the figure? Currently, there is no whitespace between each bar of the histogram. For example:
import matplotlib.pyplot as plt
import random

# Generating dummy data
coordinate_counts = [random.randrange(1,10000) for __ in range(1,100000)]

# plotting
fig, ax1 = plt.subplots()
ax1.hist(coordinate_counts, bins=range(1,10000))
I've tried using rwidth and varying the value of that, as well as tried using figsize and simply expanding the size of the plot, but the final result always has each vertical bar next to each other with no whitespace in-between.


